
VIX flashed a spike reversal last week. If history repeats itself, this probably means downward pressure on volatility, and higher stock prices. This is near term. Medium- to long-term, it will take time to heal the technical damage inflicted this month.
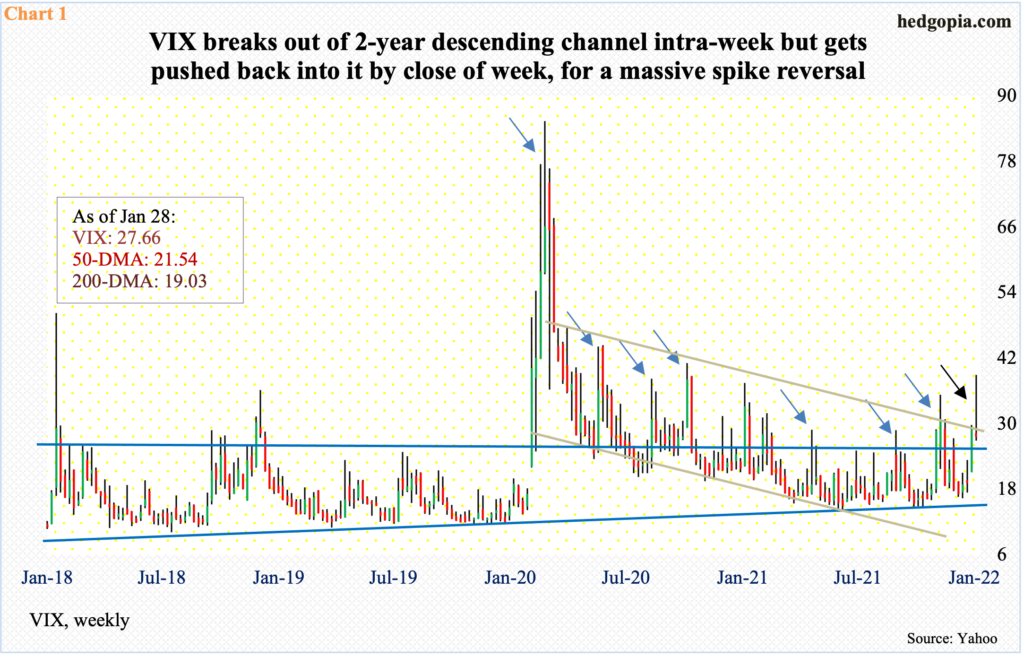
VIX last week surged 10.09 points intraday Monday but only to close the week down 1.19 points to 27.66. The resulting spike reversal bodes ill for volatility bulls.
Mid-week. the volatility index had an opportunity to break out of a two-year descending channel but was pushed back under it in the remaining two sessions.
As recently as January 4, VIX made a low of 16.34, before more than doubling at last Monday’s high. Several times in the past, spike reversals have tended to quickly unwind overbought conditions (blue arrows in Chart 1). Last week’s in all probability will meet the same fate.
There is decent support at mid-20s, which incidentally was just about tested on Wednesday when VIX tagged 26.90. A loss of mid-20s, which is looking likely in the sessions ahead, will be cherished by equity bulls.
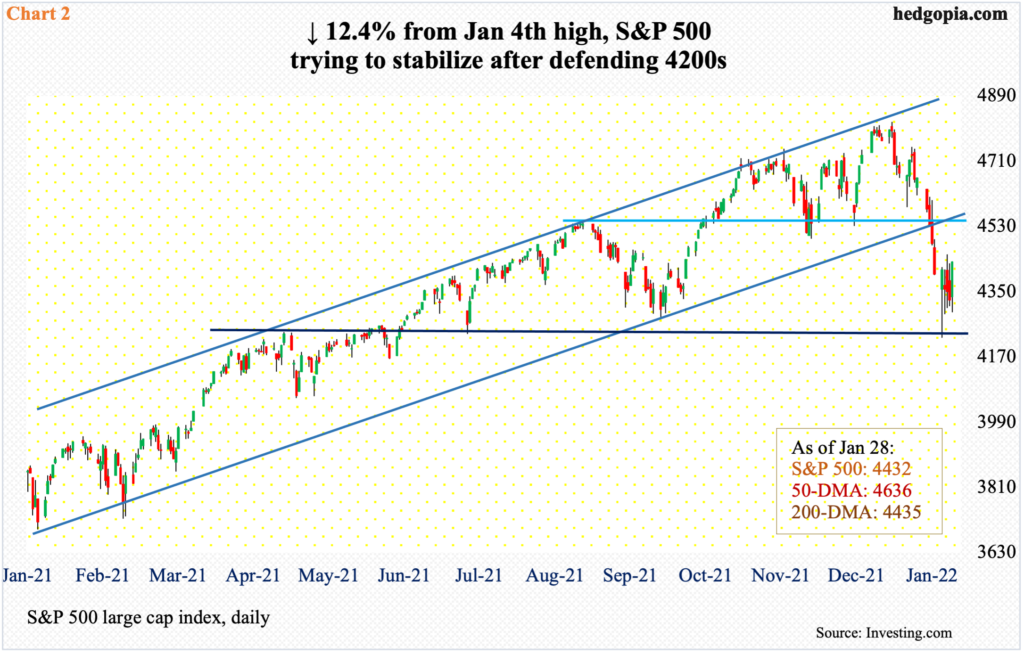
The S&P 500 peaked on Jan 4 at 4819, but ended that week in the red. This was followed by two more negative weeks – one a spinning top and the other bearish marubozu. As last week opened, downward momentum continued; at Monday’s low, the large cap index was down as much as four percent but reversed to edge up 0.3 percent, resulting in a massive hammer (Chart 2).
By last Monday’s low, the S&P 500 was down 12.4 percent from its high. Bids showed up at 4200s horizontal support from April-May last year. Besides Monday’s hammer reversal, willingness to buy was once again evident on Friday when the index rallied 100 points in the last 90 minutes, closing essentially right at the 200-day moving average.
The index (4432) is way oversold on the daily. Nearest resistance lies at 4540s.
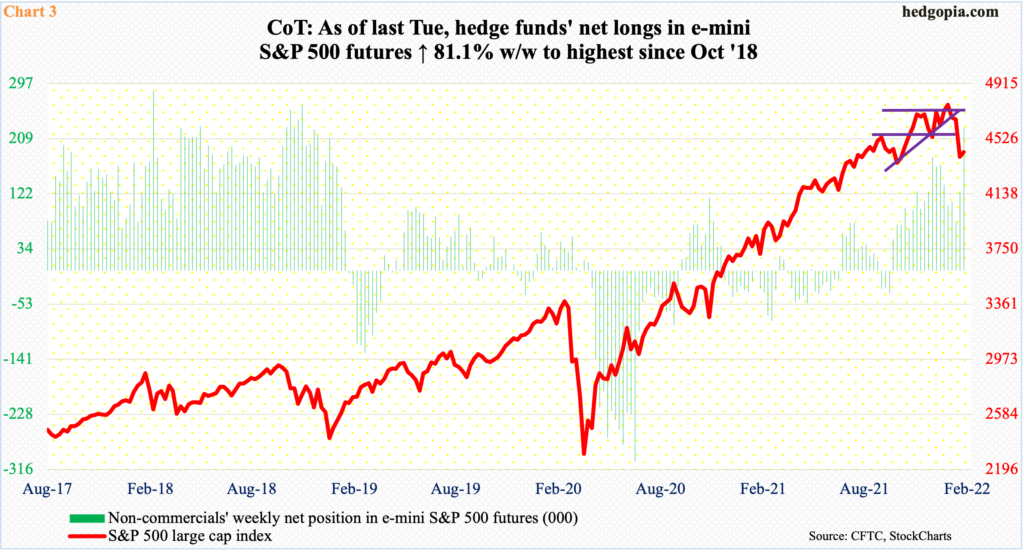
In the futures market, non-commercials are positioning for a rally.
Last week (as of Tuesday), they added 101,618 contracts in e-mini S&P 500 futures week-over-week to 226,847. They have not been this net long since October 2018 (Chart 3).
Earlier, in the week to January 11, they had reduced net longs to 77,406 contracts. The S&P 500 had already peaked and was on its way down. Then, as the cash continued lower, these traders began to add to their long exposure.
At some point, they could be overly net long raising risks of unwinding. But right here and now, they are probably on the right side of momentum.
This is near-term. Medium- to long-term, the outlook is muddled at best.
The Federal Reserve operates under a dual mandate of maximum employment and price stability. Until recently, its sole focus lied on jobs, turning a blind eye to incipient inflation, which has persisted.
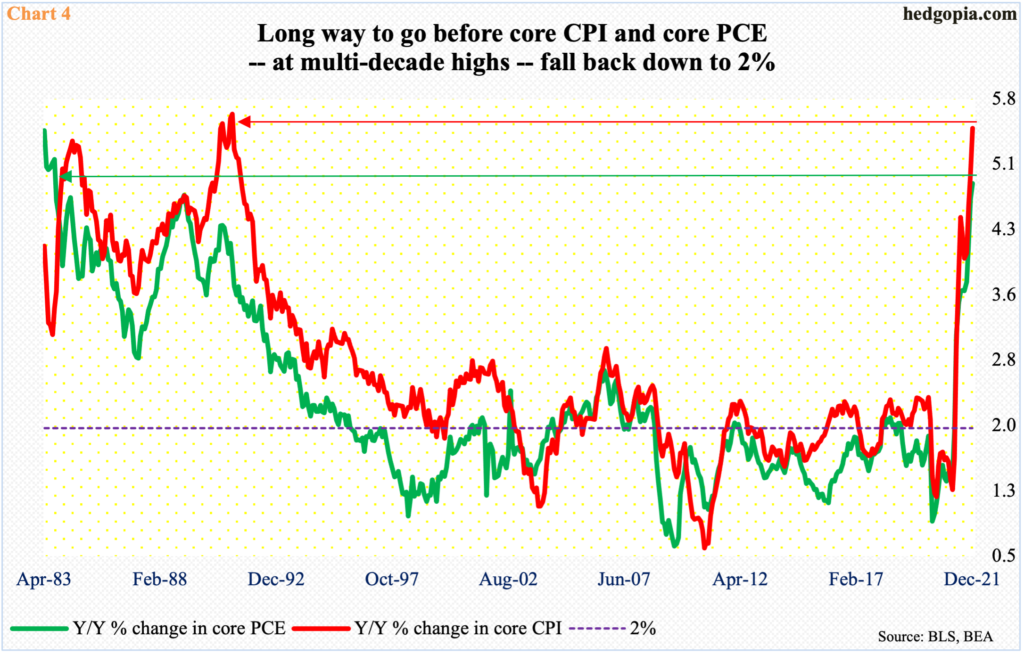
In the 12 months to December, core CPI (consumer price index) jumped 5.5 percent and core PCE (personal consumption expenditures) 4.9 percent. This was the steepest price increase since September 1983 and February 1991, in that order. As recently as February last year, these metrics respectively rose 1.3 percent and 1.5 percent.
The Fed is now focused on its inflation mandate. Chair Jerome Powell, post-FOMC meeting last week, all but confirmed an imminent rate increase in the next meeting, in March. In the futures market, traders have priced in up to five 25-basis-point hikes this year. At the press conference, Powell said that there was “quite a bit of room” to hike rates. He may have to tighten quite a bit to bring inflation back down to two percent (Chart 4).
A stock market that is spoiled by years of easy money is probably not ready for this. The risk facing the US economy – and by default corporate earnings – is significant slowdown in the quarters to come.
In the past, a sustained drop in equities led Powell’s predecessors – Alan Greenspan, Ben Bernanke, and Janet Yellen – to sooner or later ride to the rescue with loads of liquidity. How far will Powell go to protect asset prices is unknown. His predecessors were not facing rapidly rising inflation. Powell does. The dynamics are different.
As things stand, stocks are not anticipating this. Major equity indices took a hit this month but nothing major in the large scheme of things. Most importantly, earnings optimism is intact.
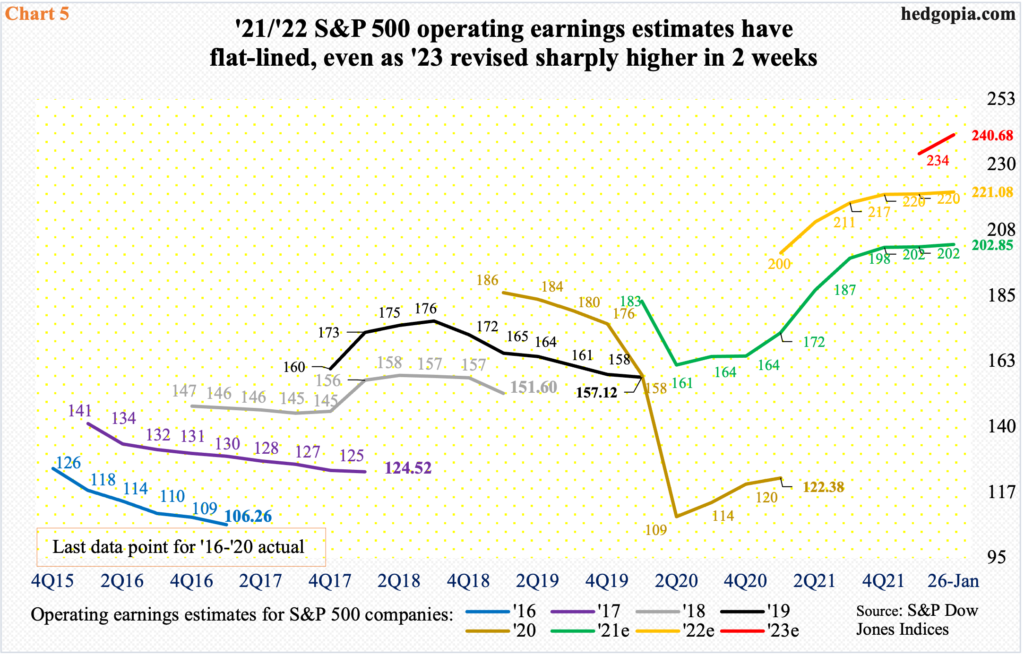
With 4Q currently being reported, 2021 S&P 500 operating earnings estimates – $202.85 as of last Wednesday – have flat-lined. This is also the case with 2022, which is at $221.08, for a nine percent increase over 2021. Ironically, the sell-side has penciled in the same growth rate for 2023, which went from $234.23 two weeks ago to $240.68 (Chart 5).
In some ways, consumers arguably are beginning to see through this. Sentiment is suppressed. The prevailing upward pricing pressure is biting into their income.
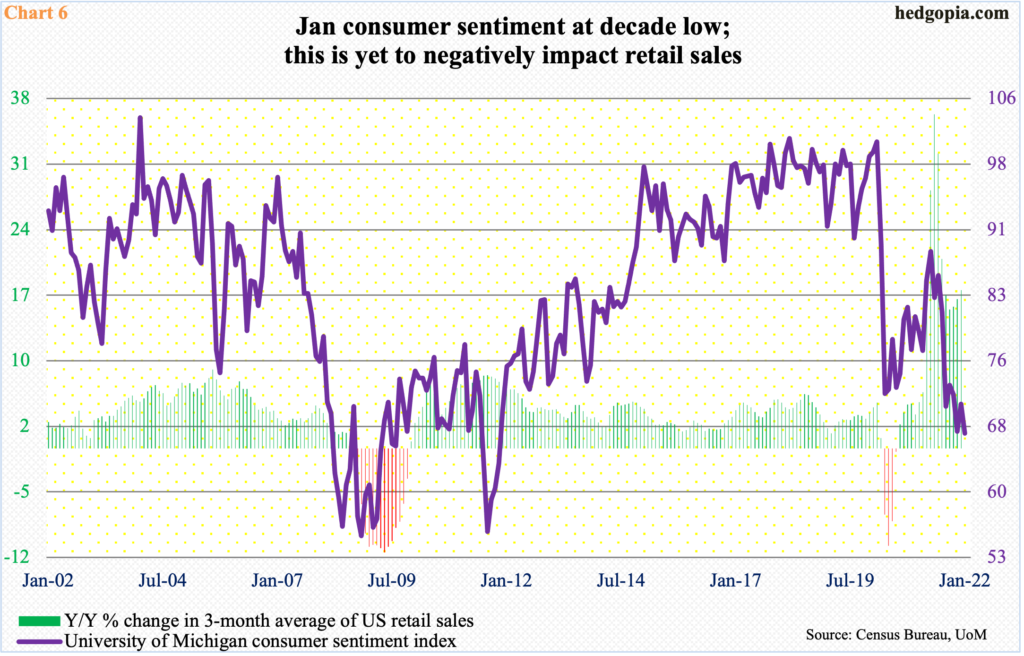
As Covid-19 began disrupting the economy, the University of Michigan consumer sentiment index collapsed from 101 in February 2020 to 71.8 two months later in April. The index gradually improved to 88.3 last April, but only to then diverge with substantial improvement in the economy. This month, sentiment dropped 3.4 points month-over-month to 67.2 – a decade low (Chart 6).
Important metrics like retail sales are holding steady near record highs but sustainability is a question mark in the face of collapsing sentiment.
In the stock land, investors are beginning to express similar sentiment through small-caps.
By nature, small-caps have larger exposure to the domestic economy compared to their larger-cap brethren which are also exposed internationally. These stocks can be used as a proxy for how investors view the economy is headed.
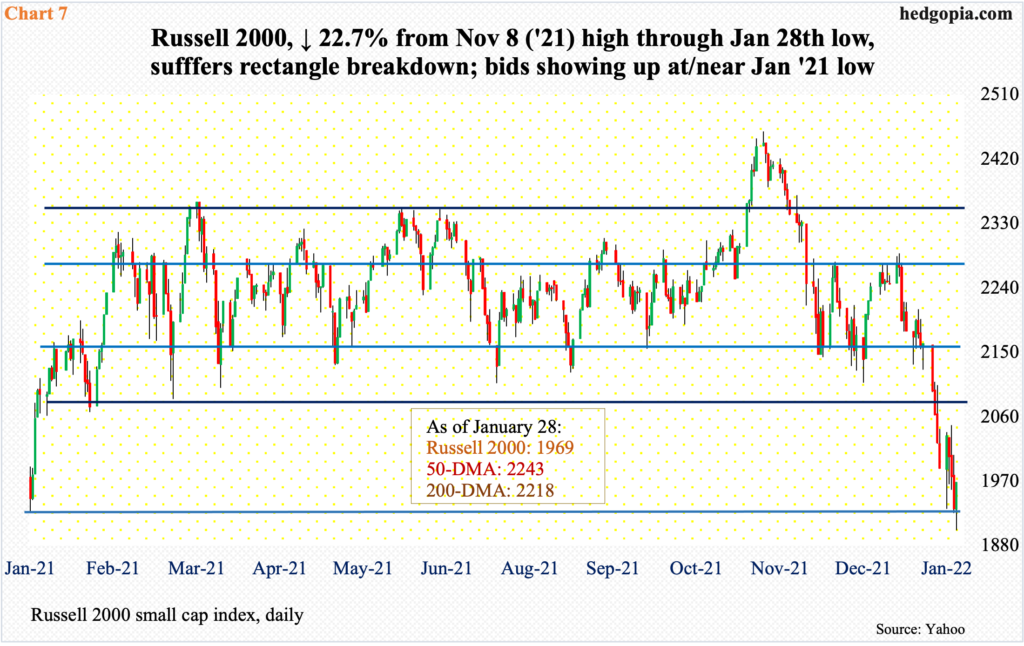
Since last March, the Russell 2000 (1969) had been rangebound between 2350s and 2080s, and between 2280s and 2150s within this rectangle. On Nov 3, the small cap index broke out but was quickly followed by a failed retest on the 19th. Two weeks ago, it fell out of the box.
Of the major US equity indices, the Russell 2000 was the only one to have breached last Monday’s low of 1931, with Friday tagging 1901. Through that low, it was down 22.7 percent from the all-time high of 2459 from November 8 (last year). It is in a technical bear market. Once again, it is the only index to have done so, with tech coming close.
Bids showed up last week near last January’s low. A breach of this support raises the odds it will in due course proceed to test major support at 1700. Immediately ahead, the path of least resistance is higher – if nothing else just to unwind oversold conditions.
Medium- to long-term, the damage it has sustained in this month’s drop will take time to heal. This is also true with other indices such as the S&P 500 (Chart 2) and the Nasdaq 100.
Thanks for reading!
