Ahead of a crucial week in which the FOMC meets and the top six US companies report, large-cap equity indices broke out to new highs last week. The knock on this is that rangebound small-caps are yet to achieve that feat. The week could be volatile, but the bias is still up.
Last week, major US equity indices all posted new highs. The S&P 500 Large Cap Index and the Nasdaq Composite shook off the prior week’s weak tape to rally two percent and 2.9 percent respectively. Both formed weekly bullish engulfing candles. The Dow Industrials underperformed with a 1.1 percent rally but is itching to break out.
From the performance perspective, the Russell 2000 Small Cap Index (2210) was not much behind its large-cap brethren, rallying 2.1 percent last week, but it remains stuck in a five-month range between 2350s and 2080s, the lower bound of which was just about tested on Monday tagging 2107. The ongoing consolidation preceded a massive rally from the lows of March last year.
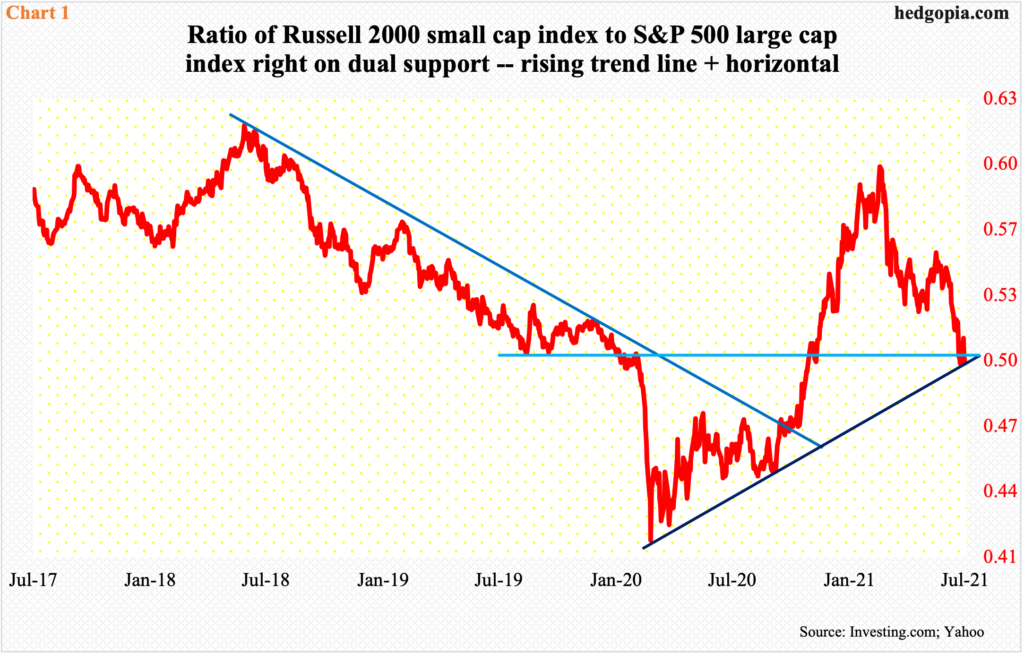
Small-caps have lagged large-caps since mid-March, with a ratio of the Russell 2000 to the S&P 500 currently sitting on dual support – rising trendline from March 2020 and horizontal from September 2019 (Chart 1).

This week will decide if the ratio manages to rally back up or continues lower. Leading up to this, the majority is betting large-caps will continue to shine.
The week could be volatile. There are two important events: (1) June-quarter results from the top six US companies, which are all tech, and (2) FOMC meeting.
Tesla (TSLA) reports today, Apple (AAPL), Microsoft (MSFT) and Google owner Alphabet (GOOG) on Tuesday, Facebook (FB) on Wednesday, and Amazon (AMZN) on Thursday. Except for TSLA, consensus estimates for the remaining five have strongly trended higher over the last 90 days (Table 1).
This is in line with the revision trend for the operating earnings estimates for S&P 500 companies. At the end of March, the sell-side expected them to bring home $41.24 in the June quarter; mid-July, this had gone up to $46.08.
Earnings have surprised to the upside, as has the economy. The massive fiscal and monetary stimulus post-pandemic has done wonders.
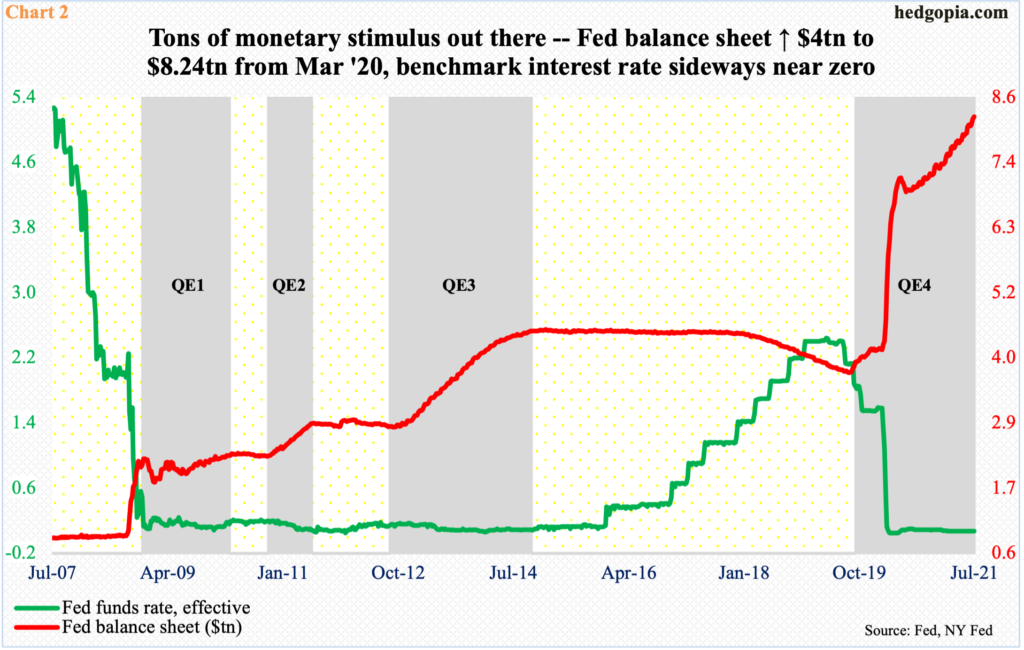
In early March last year, the Federal Reserve held $4.2 trillion in assets, which began to trend higher as far back as September 2019, before surging six months later (Chart 2). As of last Wednesday, the balance sheet had swollen to $8.2 trillion, having nearly doubled in 16 months. Every month, the central bank buys up to $80 billion in treasury notes and bonds and $40 billion in mortgage-backed securities.
Besides this unconventional tool, the Fed has kept the conventional tool – the fed funds rate – near zero between zero and 25 basis points since March last year.
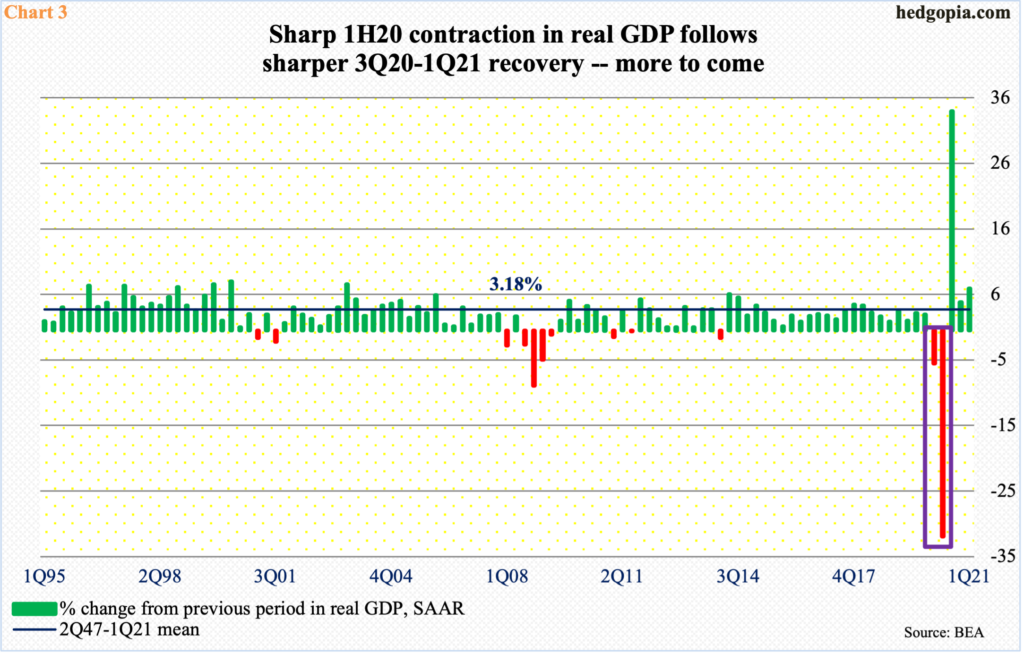
In the early months of last year, as Covid-19 took hold and the US economy ground to a halt, it made sense to adopt this emergency policy. In 1Q20, real GDP shrank five percent, followed by 31.4-percent contraction in 2Q.
At the same time, as it turns out, this was the shortest recession ever, with the economy having peaked in February that year and troughed in April. The two-quarter contraction gave way to as sharp a recovery. Real GDP grew 33.4 percent in 3Q20, 4.3 percent in 4Q and 6.4 percent in 1Q this year. The Atlanta Fed’s GDPNow model forecasts growth of 7.6 percent in 2Q. (The first estimate will be published on Thursday.)
From the perspective of stimulation, it made sense for the Fed to act with aggression when the economy was falling apart in the first half last year. That is not the case now. Besides GDP, which is on pace to post a new record in the June quarter, retail sales posted a new high ($628.8 billion) in April, even as orders for non-defense capital goods ex-aircraft – proxy for business capex plans – did so in May ($75.4 billion). The ISM Manufacturing index has been north of 60 the last six months and the non-manufacturing index the last four months.
The point is, it is hard to argue the economy at this point needs the kind of stimulus that has been shoved down its throat.
Of the Fed’s dual mandate – maximum employment and price stability – it has chosen to focus on the former. Non-farm jobs peaked in February last year at 152.5 million, before crashing to 130.2 million in April that year. From that low through June this year, 14.7 million jobs have been created, but at 144.9 million there are still 7.6 million fewer jobs than pre-pandemic.
Inflation has picked up, but the Fed views it as transitory. In the 12 months to June, headline and core CPI jumped 5.3 percent and 4.5 percent, which was the steepest price rise since July 2008 and November 1991 respectively; as recently as February, they were growing at a rate of 1.7 percent and 1.3 percent, in that order.
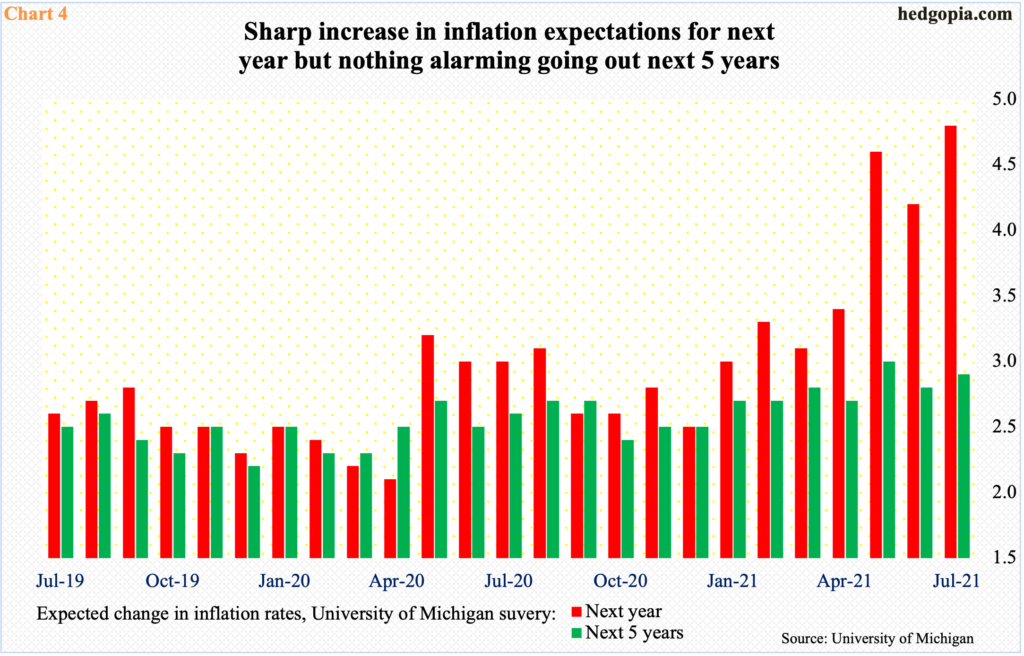
From the Fed’s perspective, the good thing is that markets – at least the majority – are on the same page. Inflation expectations have picked up but nothing alarming going out a few years. The University of Michigan’s survey shows a sharp rise in inflation expectations for next year but not for the next five years (Chart 4).
Amidst this, within the FOMC, the number of voices calling for at least the start of taper discussions is growing, although they continue to be in the minority. In this week’s meeting, tapering will be a hot topic for sure. We will probably hear something on this – maybe the layout of a plan to how to go about doing this.
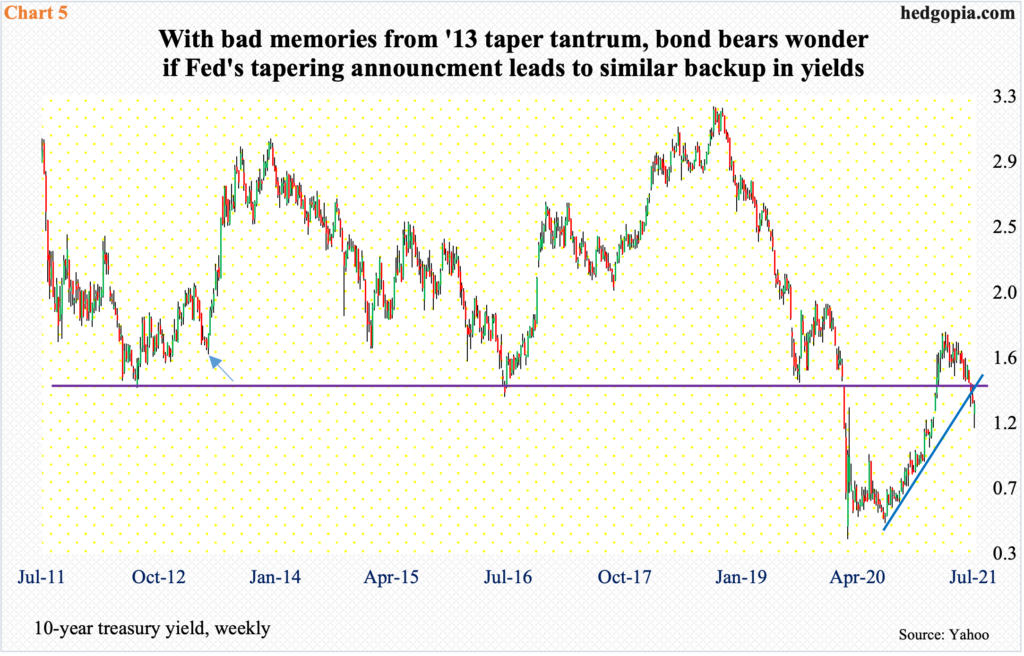
The goal is not to disrupt the markets. To many, the memories of taper tantrum in 2013 are too fresh. In May that year, then-Chairman Ben Bernanke announced that the Fed would, at some future data, reduce the volume of bond purchases. The bond market revolted. The 10-year yield bottomed at 1.61 percent on May 1 (arrow in Chart 5), rallying to 2.98 percent on September 5 and then 3.04 percent on December 31.
The Fed does not want that, not particularly when the economy is as leveraged as it is today. Between 2Q13 and 1Q21, corporate debt went from $6.9 trillion to $11.2 trillion, household debt from $13.6 trillion to $16.9 trillion. More alarmingly, federal debt stood at $16.7 trillion in 2Q13; now, it is nearly $28.6 trillion.
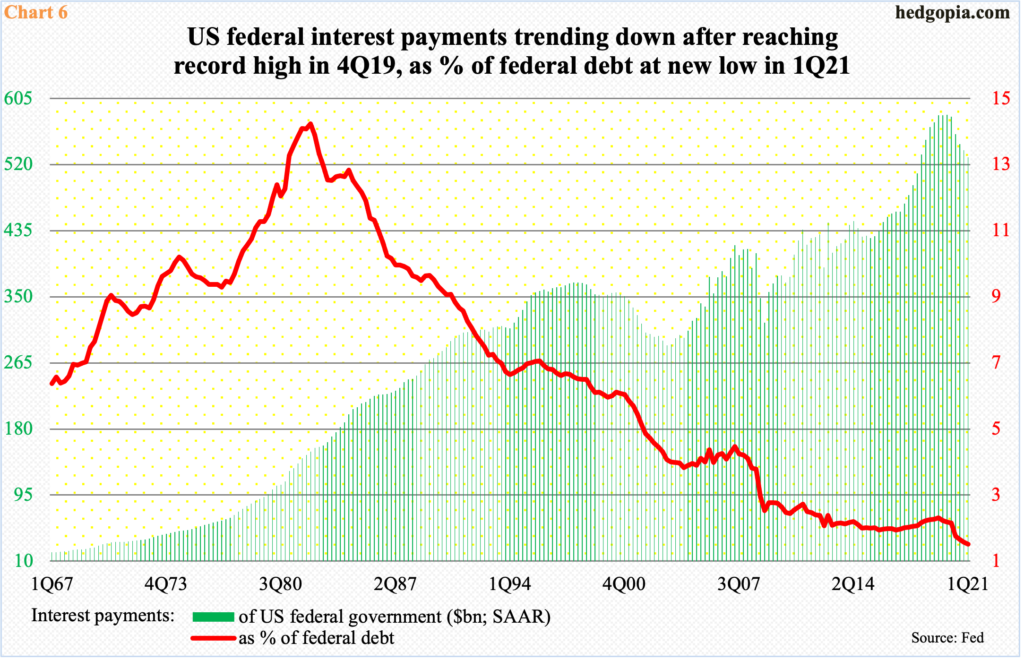
Higher rates are an anathema to debtors – be it individuals, businesses or government entities. Thanks to the Fed’s ultra-easy policy, rates are low on both the short and long ends. Despite the surge in debt, federal interest payments only went from $415 billion (seasonally adjusted annual rate) in 2Q13 to $529.7 billion in 1Q21. Payments reached record $584.5 billion in 4Q19, with an effective interest rate of 2.5 percent. This was just before the Fed pulled out its stimulative bazooka. In 1Q21, the effective rate was 1.9 percent (Chart 6). Assuming rates were only a percent higher, payments would shoot up to $810 billion.
This is prohibitively high. The Fed knows this, hence the need to engineer low rates. The markets know this, they know that the Fed’s hands are tied. Equity longs are betting that the central bank is not in a position to rock the boat.
For perspective, post-Bernanke comments in 2013, bonds were heavily sold, but not equities, which dipped slightly in June but only to then continue higher. This was probably because the Fed did not actually slow its QE. The situation is different now.
If FOMC hawks feel the need to placate the doves, which probably happens, then tapering will happen sooner or later – sooner if doves like St. Louis Fed President James Bullard had their way. This is a new dynamic, and stocks likely will struggle in this environment. This is medium- to long-term, and it is a risk. Near term, after last week’s price action, odds favor longs will try to react positively to both earnings and FOMC meeting.
Thanks for reading!

