
The week started out strong, with Monday producing handsome gains on all major US equity indices. Before bulls could carry the momentum further, bears showed up in droves Tuesday at/near horizontal resistance – some minor, some major.
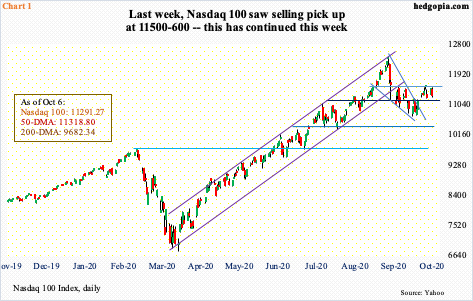
The Nasdaq 100 index has straddled the 50-day for a month now. After losing it three weeks ago, the tech-heavy index remained underneath the average for seven sessions before reclaiming it on Monday last week.
Last week, the index essentially closed on the average. This week, bulls opened Monday with a 2.3-percent rally, closing right at short-term horizontal resistance at 11500-11600 (Chart 1). A takeout of this level would bring bulls one step closer to testing the all-time high of 12439.48 from September 2.
There is a lot of fuel for short squeeze in tech. Mid-September short interest on the Nasdaq composite was near a 12-year high (more on this here). In the futures market, non-commercials last week reduced net shorts in Nasdaq 100 index (mini) futures, but the prior week was the highest since August 2006. A squeeze has the potential to act as a self-fulfilling prophecy.
Tuesday, bulls sought to build on Monday’s momentum, rallying the index to 11536.42 intraday, but only to reverse hard. When it was all said and done, the index (11291.27) closed down 1.9 percent – just under the 50-day at 11318.80. Bulls now need to save decent support at 11100-11200.
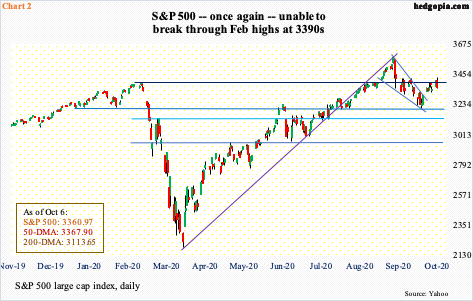
A similar reversal occurred on the S&P 500 large cap index (3360.97).
As is the case with the Nasdaq 100, the S&P 500 has straddled the 50-day for a month now. It closed out last week just underneath the average, which it recaptured Monday with the help of a 1.8-percent rally. Bulls tried to build on this Tuesday by pushing through resistance at 3390s intraday but were unable to hang on to the gains; from the intraday high of 3431.56, the index (3360.97) closed down 2.1 percent. In the end, bears defended straight-line resistance at 3390s, which goes back to February this year (Chart 2).
Nearest support lies at 3220s-30s.
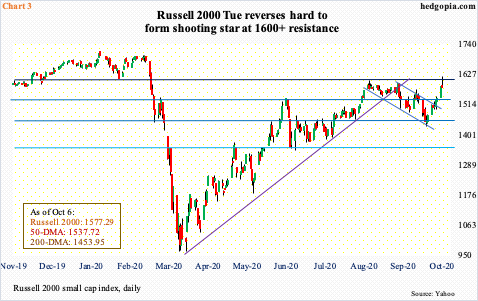
Bulls – small-cap bulls in particular – were probably most disheartened by how the Russell 2000 acted Tuesday. Unlike its large-cap peers, the small cap index last week both opened and closed strong, rallying 4.1 percent, essentially closing right on its 50-day (Chart 3). Intraday Tuesday, it was up another 2.4 percent to 1619.21; then, it hit the wall, closing the session down 0.3 percent. The shooting star reversal came right at major resistance (more on this here).
Going back to January 2018, just north of 1600 has proven to be a crucial price point for both bulls and bears. Bulls last lost this level late February this year, before bottoming at 960s in the second half of March. The rally off of that low stopped at 1600-plus early August. Subsequently, bulls managed to defend 1450s-60s.
Tuesday’s rejection now raises the odds that the index (1577.29) once again is headed for a test of 1530s. The 50-day at 1537.72 lies there as well.
Thanks for reading!
