
Equity bulls used the Yellen dip last Tuesday as an opportunity to add to risk, not reduce. The Fed is making sure liquidity remains plentiful, and the short end of the yield curve is cooperative. In this environment, VIX on Friday breached short-term trend line support.
The mini selloff last Tuesday caused by Treasury Secretary Janet Yellen’s interest rate comments was used as an opportunity to buy. Yellen said at an event that “it may be that interest rates will have to rise somewhat to make sure that our economy doesn’t overheat.”
The immediate reaction in the equity market was to shoot first and ask questions later. The S&P 500 large cap index dropped 0.7 percent and was down 1.5 percent at the session lows. The Nasdaq 100 was down 1.8 percent and was down as much as 2.9 percent.
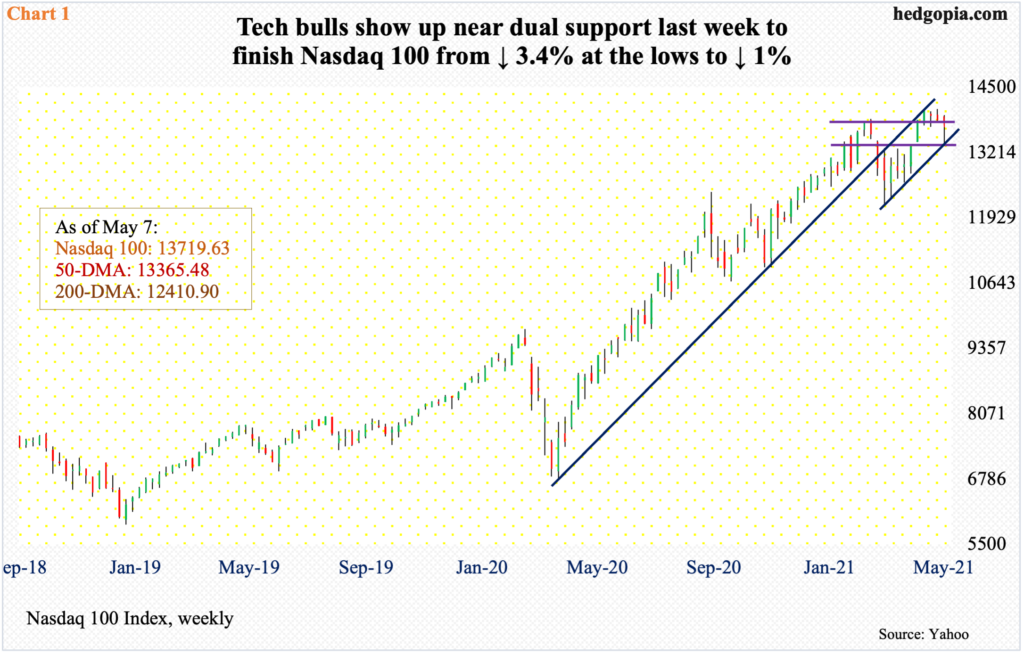
On the S&P 500 (4232.60), bulls defended short-term horizontal support at 4120s and by Friday rallied the large cap index to a new high. No such luxury for the Nasdaq 100, but it also defended important support on Tuesday. It gapped lower, with the session low of 13396.11 finding support at a confluence of four-month horizontal support and two-month rising trend line. To boot, the 50-day is at 13365.48.
The tech-heavy index (13719.63) rallied off of the triple support but not enough to take out 13840s. On Thursday, Tuesday’s low was again defended before rallying. This was then followed by Friday’s 0.8-percent rise which filled Tuesday’s gap, although sellers showed up at the highs, ending the session with a long-legged doji.
The Nasdaq 100 already breached a rising trend line from the low of March last year, the underside of which is now repelling rally attempts (Chart 1).
It is possible shorts got active post-Yellen comments. It is also possible they covered as the week progressed.
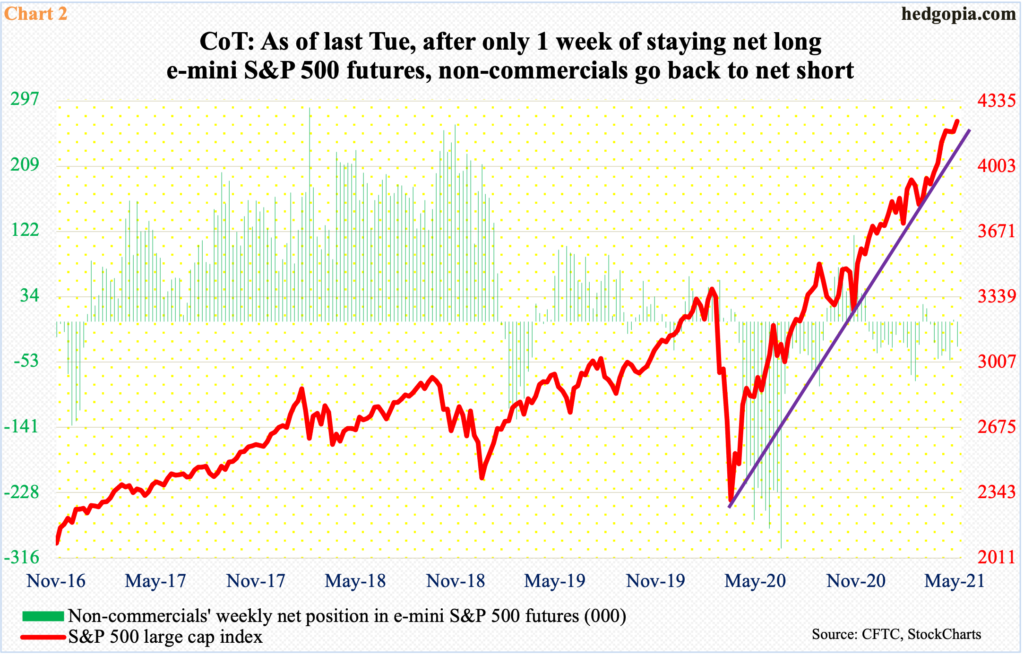
As of last Tuesday, non-commercials’ net shorts in Nasdaq 100 index (mini) futures stood at 16,803 contracts, up 9,045 week-over-week. They also raised their net shorts in Russell 2000 mini-index futures from 20,172 to 23,065 contracts (more on this here). In fact, in e-mini S&P 500 futures, they switched from net long 2,284 to net short 33,815 contracts (Chart 2).
From Tuesday’s low to Friday’s new high, the S&P 500 rallied 2.7 percent – not the kind of outcome these traders were probably anticipating. They likely covered, and this may have in fact helped the index post a new high last Friday.
Stocks’ knee-jerk reaction on Tuesday apart, they are keenly watching the short end of the treasury yield curve. The long end is on the move – albeit slightly – with the 10-year (1.58 percent) having broken out of one percent early this year and then ticked 1.77 percent on March 30.
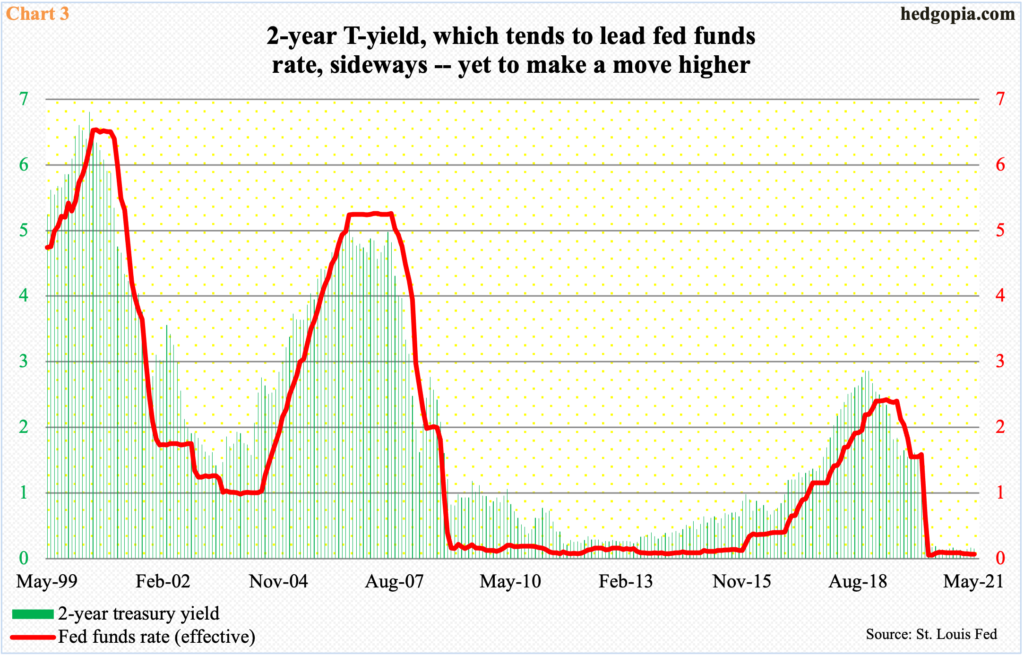
But two-year yields are well anchored in a range of 15 to 16 basis points. On Tuesday, the day Yellen spoke, yields were unchanged at 0.16 percent. This section of the curve tends to be the most sensitive to interest rate policy. Historically, they have tended to lead Fed action (Chart 3).
As things stand, of its dual mandate of maximum employment and price stability, the Fed is focused more on the labor market and less on inflation.
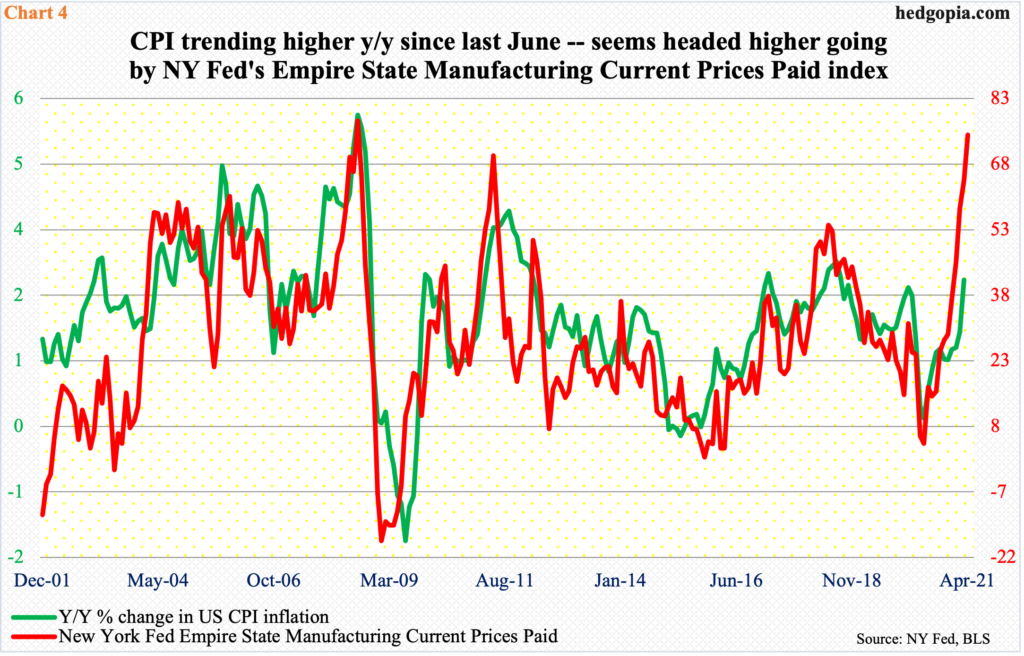
Inflation is showing subtle signs of building. In the 12 months to last May, the consumer price index barely grew, up 0.12 percent. Post-pandemic, as the economy gradually began to open up, consumer prices began to firm up. In March, they grew at a 2.62 percent rate. Numbers for April are due out this Wednesday.
If the New York Fed’s Empire State Manufacturing Current Prices Paid subindex is any indication, consumer prices have a lot of catching up to do (Chart 4). In April, the index jumped 10.3 points month-over-month to 74.7. Last May, it languished at 4.1.
The debate is not about if inflation is percolating, rather if the expected increase is transitory or persistent. Yellen seems to be suggesting it is the latter, although speaking at a different event later that day she tried to walk back her comments, saying any price increases would be transitory.
This is precisely the line used by the Fed. At the end of the March FOMC meeting, members raised their real GDP growth forecast this year to 6.5 percent, up from 4.2 percent made last December; core PCE inflation forecast went from 1.8 percent to 2.2 percent but is expected to moderate next year. In March, this measure of inflation jumped 1.83 percent year-over-year; in April last year, growth went sub-one percent at 0.93 percent.
The focus away from inflation allows the Fed to solely focus on jobs and continue with its accommodative policy. The fed funds rate – the conventional tool – is already zero-bound, hence the use of unconventional tools.
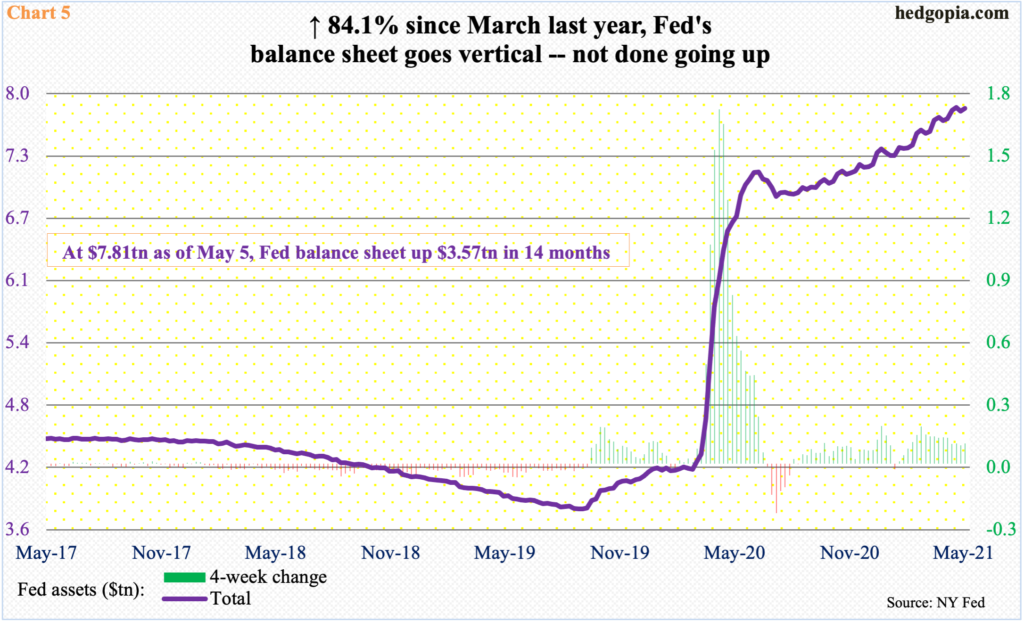
In the last 14 months, the central bank’s balance sheet has gone up by $3.57 trillion to $7.81 trillion. That is a lot of liquidity sloshing around in the system. It has to go somewhere. The pace of increase has obviously moderated versus a year ago but the four-week change is solidly positive (Chart 5).
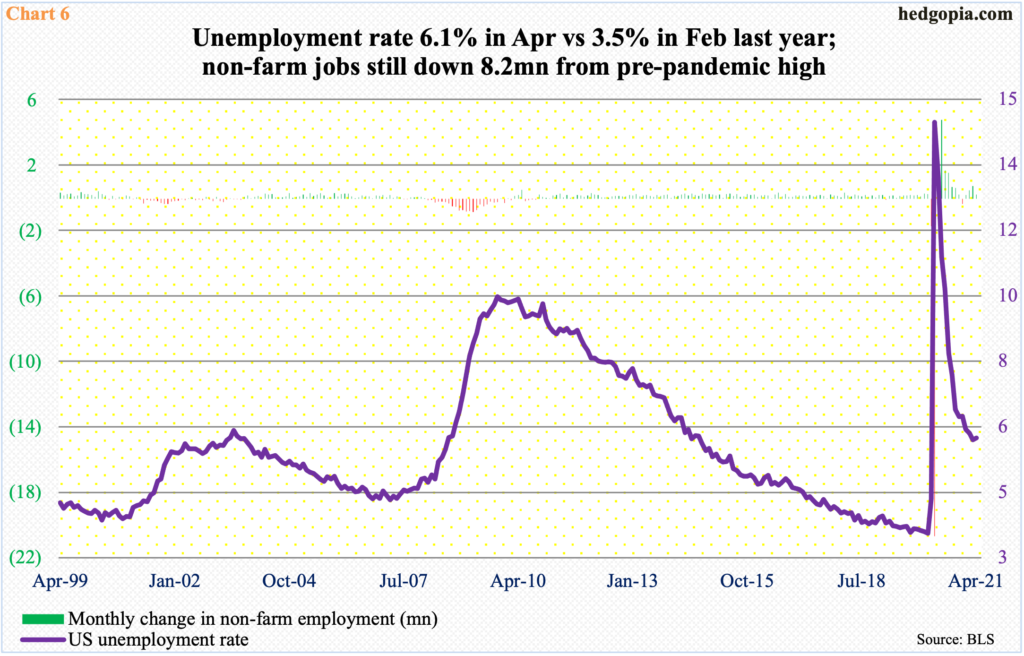
Amidst this came April’s employment report, which kind of vindicated the Fed last Friday. The economy only produced much-weaker-than-expected 266,000 non-farm jobs, bringing the monthly average this year to 451,000.
At 144.3 million, non-farm jobs are still 8.2 million short of the pre-pandemic record high of 152.5 million jobs reached in February last year. The unemployment rate similarly was 3.5 percent – the lowest since May 1969 – back then, versus 6.1 percent in April (this year).
If the Fed is determined to get to the levels before the pandemic sent in, there is a lot of catching up to do. The only question is, in its quest to do so, will it also have released the inflation genie out of the bottle? The short end of the curve is not worried about these prospects, not to mention equities, which seem to be benefiting from a ‘heads I win tails you lose’ phenomenon. If last Friday’s jobs report met expectations, it would be viewed as one more data point symbolizing that the recovery was firmly in place. Now that the report disappointed, it is used to argue the Fed would continue to stay easy.
Yellen could be right in the long run – or not. Time will tell. But, right here and now, until the short end of the market begins to rebel, the Fed is set to turn a blind eye to inflationary pressures. April’s jobs numbers just made sure of that.
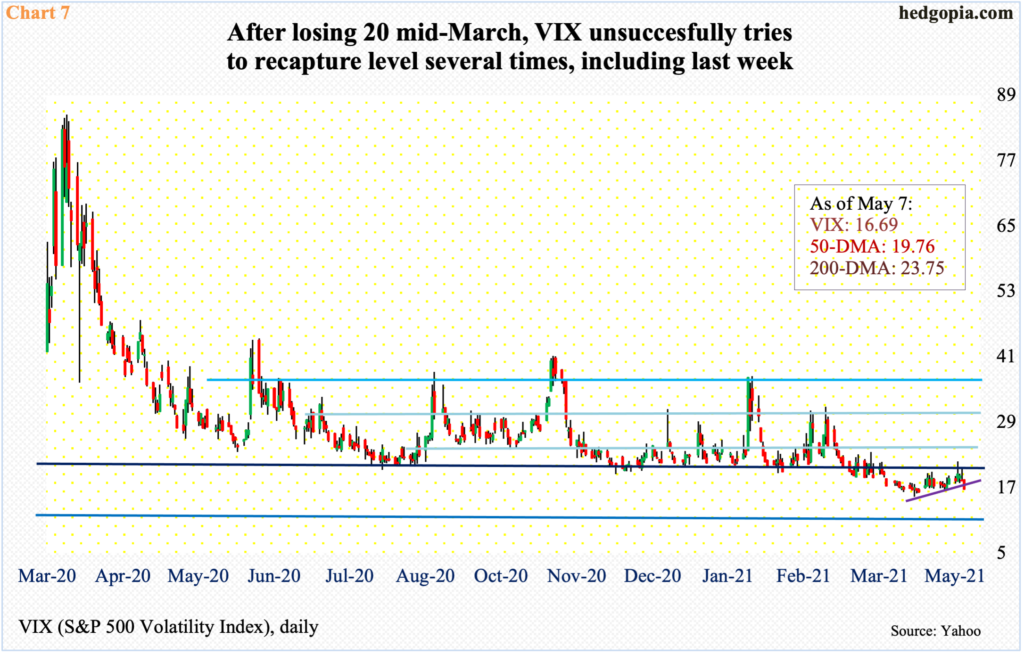
VIX probably sensed these dynamics last week and suffered a mini breakdown. On April 14, the volatility index posted an intraday low of 15.38 before turning higher. A rising trend line drawn from that low was breached on Friday (Chart 7).
This negated the prior week’s constructive action in which VIX completed a potentially bullish 10- and 20-day crossover, but momentum was cut short at 20 to low-20s, which was lost mid-March. Last Tuesday, VIX (16.69) rallied to tick 21.85 but only to leave behind a long upper shadow by close. Intraday Thursday, it touched 20.60, but the gains were frittered away to form a gravestone doji.
VIX acts as if it wants to go lower. There is support at 15-16. The April 14 low is likely in play. A loss of this level exposes the index to risks of low teens. The S&P 500 should like that, should things evolve this way.
Thanks for reading!
