
Following futures positions of non-commercials are as of April 9, 2024.
10-year note: Currently net short 506.9k, down 63.1k.
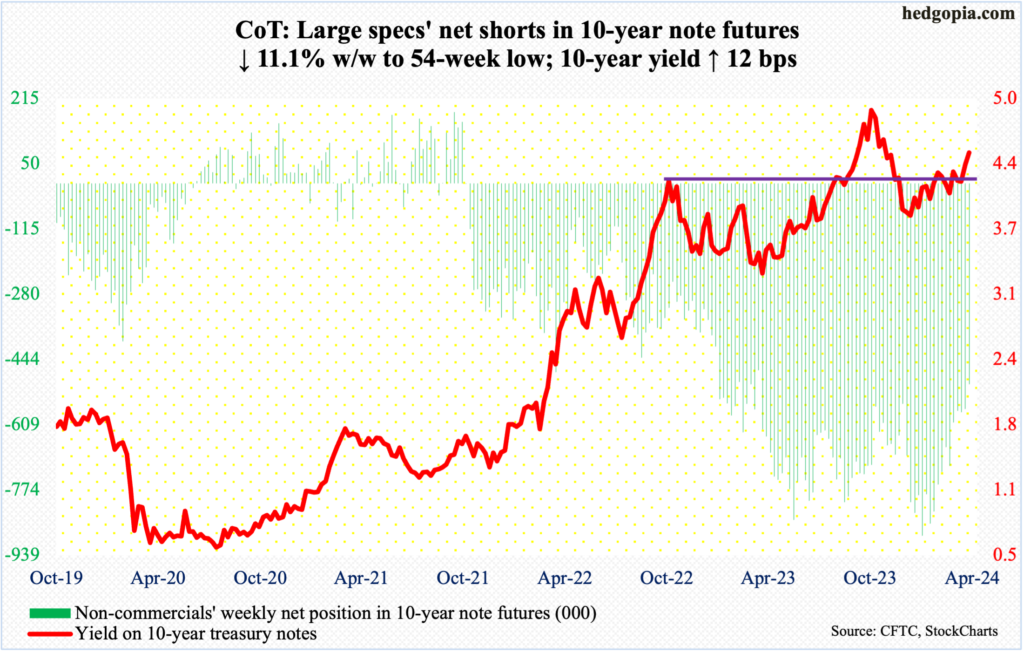
In the past month, the 10-year treasury yield went from 4.04 percent on March 8th to Thursday’s high of 4.59 percent. Go back even further, these notes were yielding 3.82 percent on February 1st and 3.79 percent on December 27th.
In a little over three months, the 10-year rallied 80 basis points. Non-commercials are using this upsurge in yields as an opportunity to cut back on their massive holdings of net shorts in 10-year note futures.
In the week to January 16th, these traders were net short a record 889,385 contracts, which by this Tuesday was reduced to 506,885 – a 54-week low. These still represent massive holdings, but the trend is down.
Rates closed this week at 4.5 percent. At least going by non-commercial action, bond bears (on price) do not believe the current rally in yields will sustain itself and thus are looking to cover. The 10-year peaked last October at five percent, and in all probability this probably remains a cycle high (more on this here).
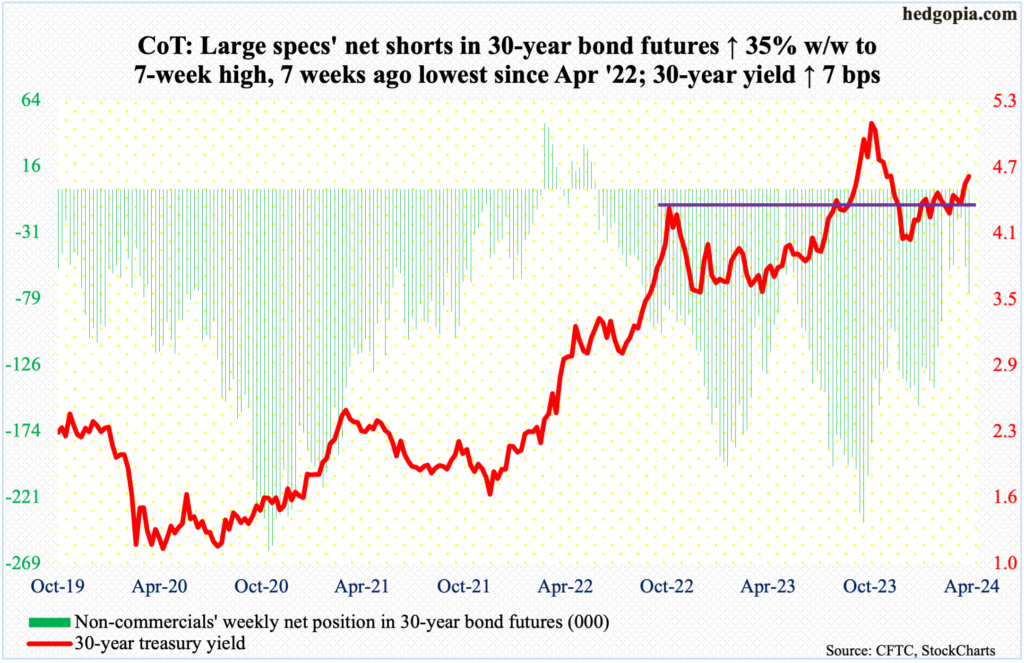
30-year bond: Currently net short 75.2k, up 19.5k.
Major US economic releases for next week are as follows.
Retail sales (March) and the NAHB housing market index (April) are due out Monday.
In February, retail sales grew 0.6 percent month-over-month to a seasonally adjusted annual rate of $700.7 billion. Sales peaked at $705.3 billion last September; since then, sales have come in north of $700 billion in all but one month.
Homebuilder optimism increased three points m/m in March to 51 – an eight-month high. The index has risen each month since dropping to 34 last November.
Tuesday brings housing starts (March) and industrial production (March).
Starts in February increased 10.7 percent m/m to 1.52 million units (SAAR), which was a two-month high.
Capacity utilization was unchanged m/m in February at 78.3 percent, which was the lowest since June 2021. In September 2022, utilization hit a cycle high 80.8 percent.
Existing home sales (March) will be published on Thursday. February sales were up 9.5 percent m/m to 4.38 million units (SAAR) – a one-year high.
WTI crude oil: Currently net long 333k, up 5k.
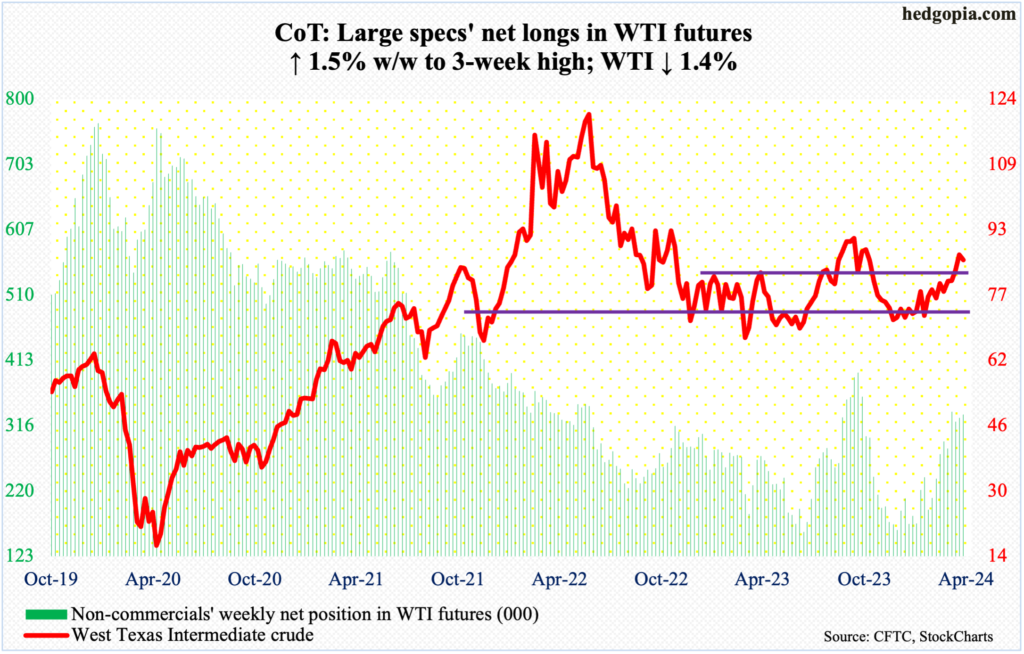
After 4 consecutive up weeks, West Texas Intermediate crude dropped 1.4 percent this week, forming a weekly spinning top. Friday was a huge reversal session, with the intraday high of $87.67 drawing sellers near prior Friday’s spinning top high of $87.63 and reversing to end the session at $85.66/ barrel.
There is horizontal resistance at $88. The crude has come a long way from last December’s bottom at $67.71.
On its way to the recent highs, WTI went back and forth between $71-$72 and $81-$82 for a year and a half before pushing through the upper end two weeks ago. At this stage, a successful breakout retest will be a welcome development for the bulls.
In the meantime, as per the EIA, US crude production in the week to April 5th was unchanged for five consecutive weeks at 13.1 million barrels per day; seven weeks ago, output was at a record 13.3 mb/d. Crude imports decreased 184,000 b/d to 6.4 mb/d. Stocks of crude, gasoline, and distillates all rose – respectively up 5.8 million barrels, 715,000 barrels and 1.7 million barrels to 457.3 million barrels, 228.5 million barrels and 117.7 million barrels. Refinery utilization dropped three-tenths of a percentage point to 88.3 percent.
E-mini S&P 500: Currently net short 62.9k, down 15.2k.
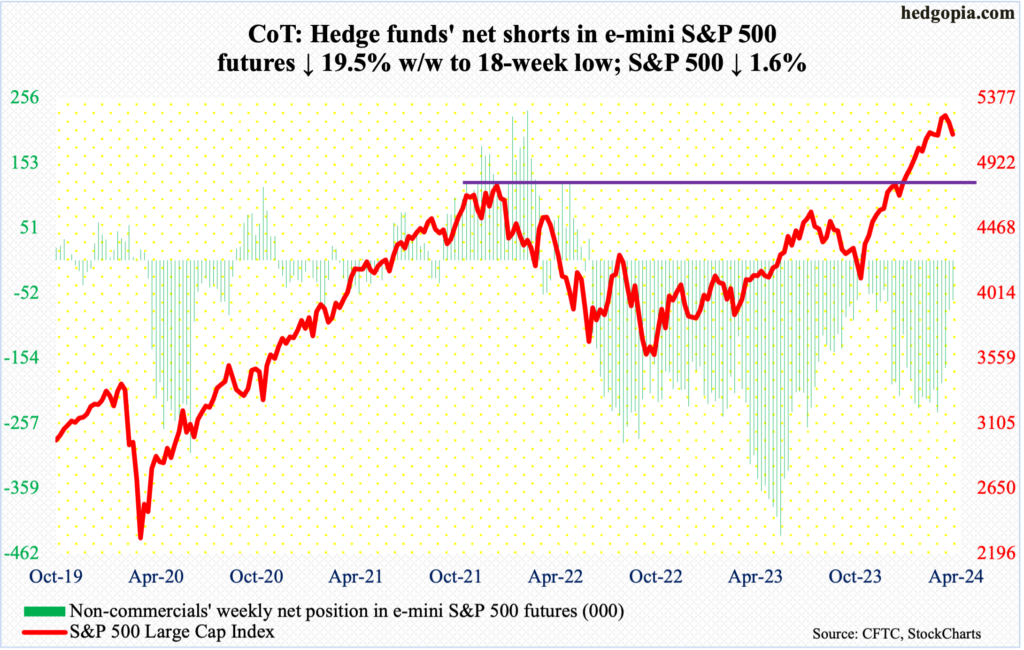
Equity bulls are at risk of losing short-term momentum on the S&P 500. A potentially bearish cross-down between the 10- and 20-day averages is complete. This is the second time since last October’s low this has occurred. The first one took place mid-January, but that did not amount to much, lasting just a couple of sessions. Back then, the 50-day was much lower; this time around, the average (5111) is right here. In fact, Friday’s intraday low of 5108 did attract some buying, with the large cap index down 1.6 percent for the week to 5123. The index peaked at 5265 on March 28th.
Bears have an opportunity here. For the bulls, the ongoing collapse in bearish sentiment is a problem, as what has been a tailwind is turning into a headwind (more on this here). To boot, trendline support from last October has been breached.
Immediately ahead, in the event of a rally, bulls’ first test will occur at 5170s.
Euro: Currently net long 32.7k, up 15.9k.
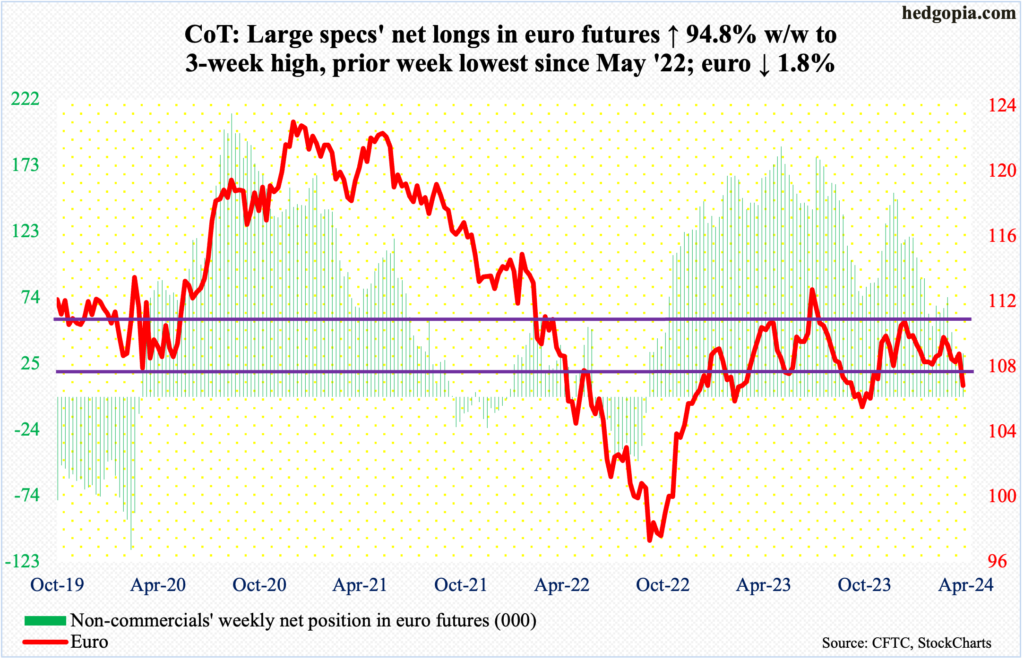
The European Central Bank gave strong hints that rate cuts are on the way – maybe as soon as June – and that it is “data-dependent, not Fed-dependent” to carry out its policy.
That said, US inflation and interest rates are bound to impact the ECB’s policy through the euro. For the week, reacting to the ECB commentary as well as a strong greenback, the currency dropped 1.8 percent to $1.0644.
The euro fell in four of the five sessions, with a weekly high of $1.0885 on Tuesday. The currency has trended lower after ticking $1.0981 on March 8th. There is horizontal resistance at $1.10.
Last October, the euro bottomed at $1.0448, which has now gained in significance.
Gold: Currently net long 202.4k, down 4.8k.
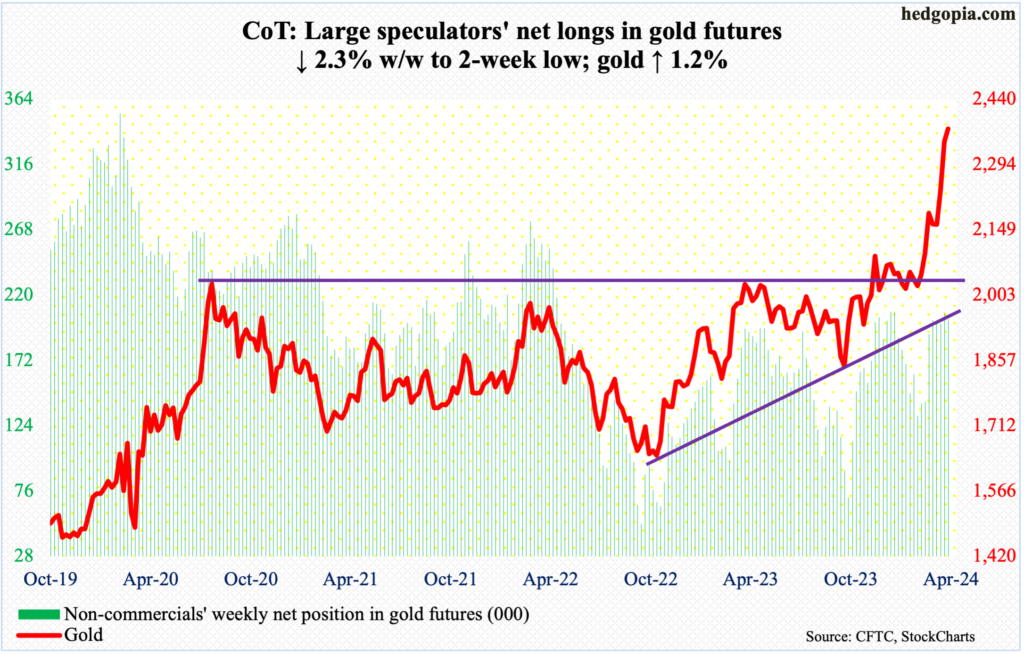
After just about going parabolic since early March when gold broke out of $2,080s, there were signs this week that the current rally has come too far, too fast. A breather is due and should be healthy. This week, the metal ticked $2,449 intraday Friday but only to end the session at $2,374/ounce, still up 1.2 percent for the week.
Gold bugs need to pay attention to this week’s candle with a very long upper shadow. This has appeared after a vicious rally. Last October, gold bottomed at $1,824.
At some point, breakout retest at $2,080s will occur. But before that happens, gold bugs will probably try to defend nearest support at $2,240s.
Nasdaq (mini): Currently net long 7.5k, up 12.7k.
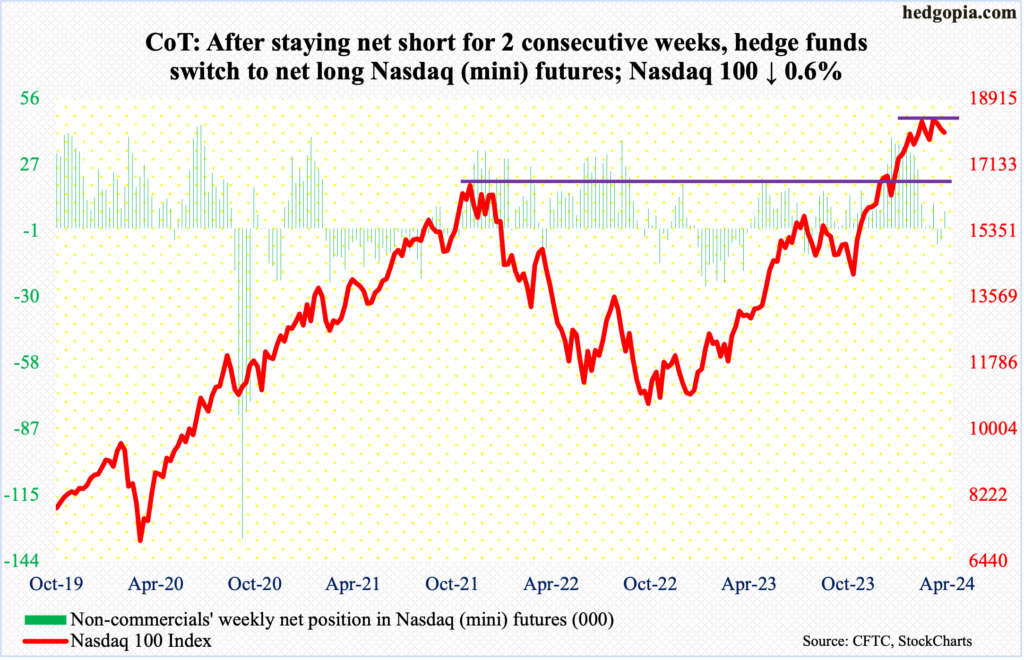
As did the S&P 500, the Nasdaq 100 ended the week essentially right on the 50-day (17984). In fact, Friday’s intraday low of 17952 did breach the average but closed the session at 18003. The tech-heavy index has essentially hugged the average the last seven sessions. Inability to rally right off the average raises the risk that a breach is just a matter of time.
Non-commercials probably do not think a breach is in order – at least not right away anyway. After staying net short Nasdaq (mini) futures for a couple of weeks, they switched to net long this week.
For a breach not to occur, catalysts are needed, and the major US tech outfits do not report until late April and early May. Momentum has been down since the Nasdaq 100 peaked on March 21st at 18465, followed by a breach of a rising trend line from last October’s low.
Russell 2000 mini-index: Currently net short 27.6k, up 5.4k.
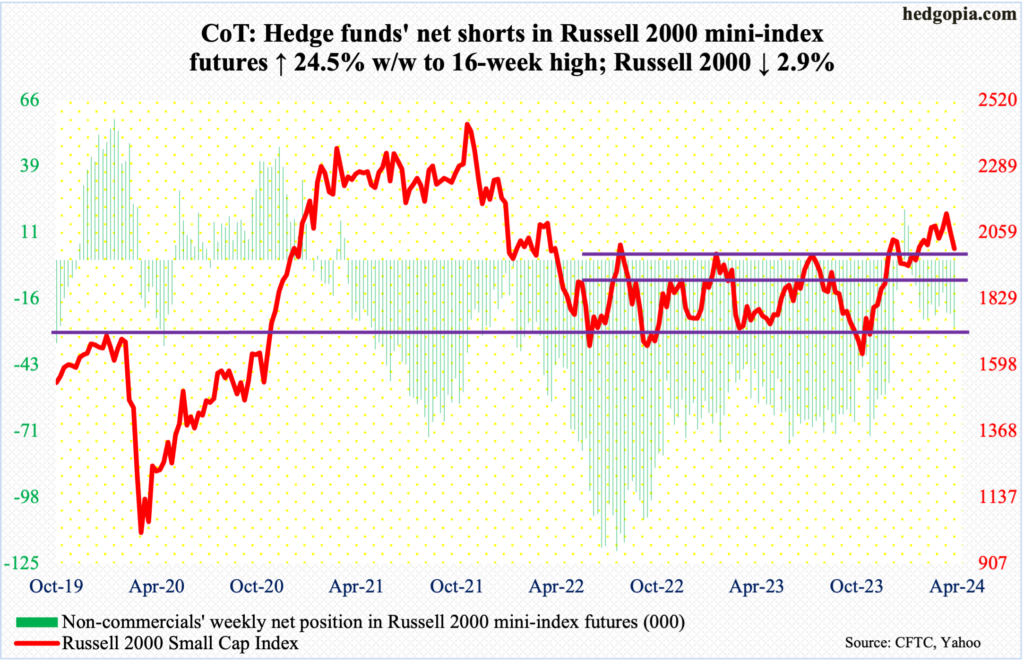
Once again, small-cap bulls are being forced to defend 2000. The Russell 2000 declined 2.9 percent this week to 2003, having tagged 1995 intraday Friday. Inability to save 2000 will expose the index to breakout retest at 1900. On December 13th, it broke out of a 1700-1900 range in place since January 2022.
As things stand, bulls have their back against the wall, as for nearly a month through early this month several tries at 2100 were rejected. Horizontal resistance at 2100 goes back to January 2021. This level also represents a measured-move target of the 1700-1900 range breakout.
Much as the S&P 500 and the Nasdaq 100 did, the Russell 2000 has now compromised trendline support from last October’s low.
US Dollar Index: Currently net short 1.1k, down 754.
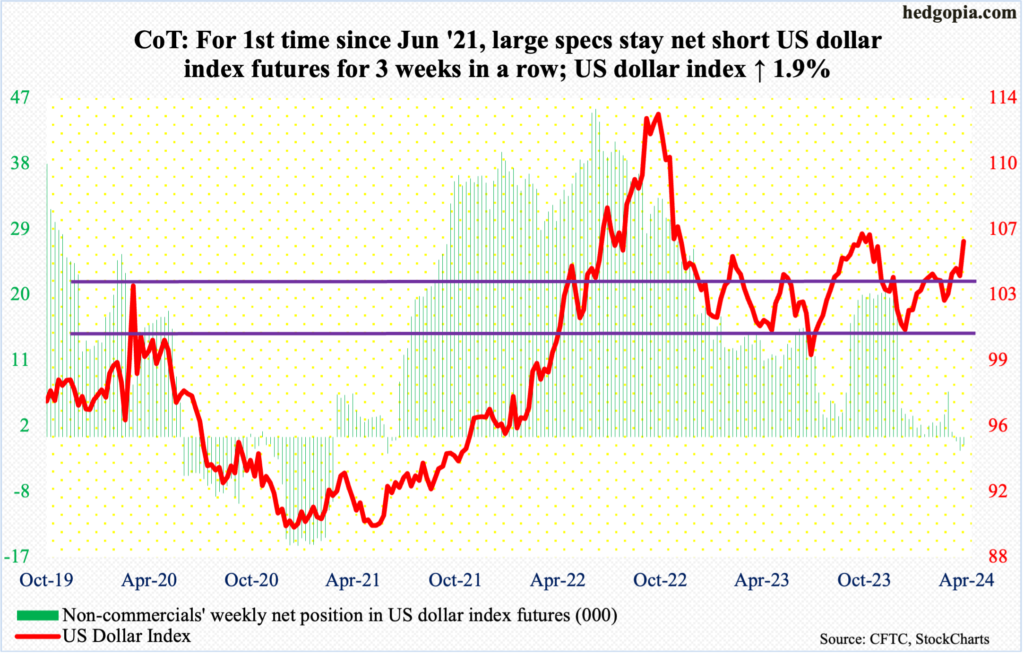
The US Dollar Index had a huge week, up 1.9 percent to 106.01. Resistance at 103-104 goes back to December 2016, and since bottoming at 102.30 on March 8th, it hesitated at the upper end for a few weeks. This week, the resistance was emphatically taken out.
Between early October and early November last year, sellers showed up at 107, which dollar bulls are probably eyeing for now.
VIX: Currently net short 31.3k, down 19k.
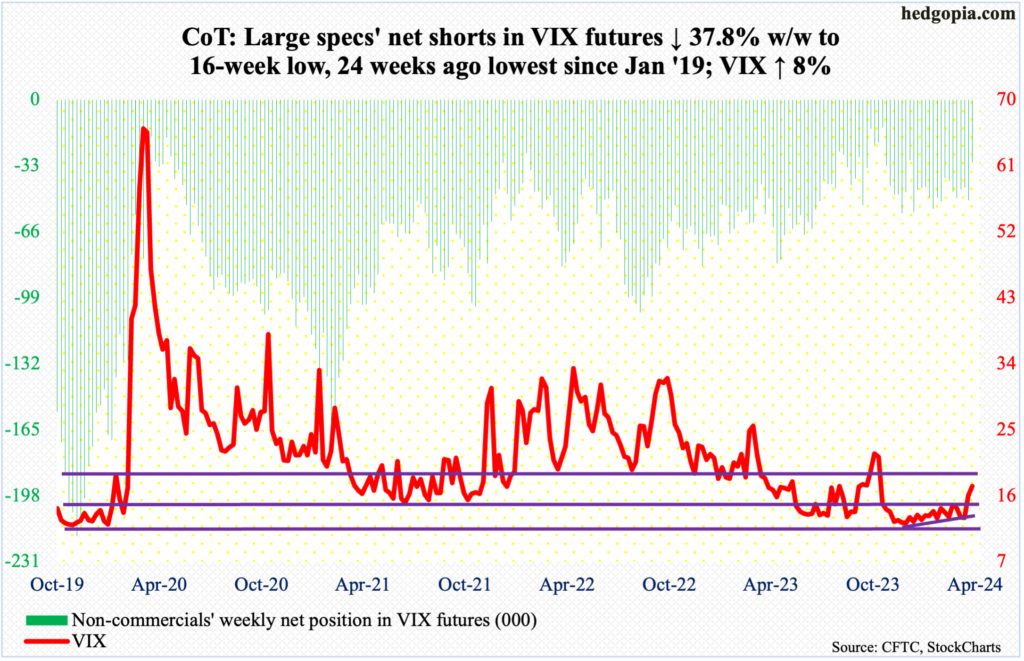
VIX closed out the week at 17.31 but rose as high as 19.20 intraday Friday; this was the highest print since October 31st. Back then, after spiking to 23.08 on October 23rd – just before US stocks bottomed – the volatility index was on its way down.
Now, the trend is looking up, with both the 50- and 200-day beginning to turn up – although ever so slightly. If the weekly prevails, volatility likely continues to firm up. The only thing volatility bulls need to watch out for is if Friday’s action is part of a spike reversal. They definitely would not want to see a similar spike followed by a reversal next week.
Thanks for reading!
