
Following futures positions of non-commercials are as of January 26, 2021.
10-year note: Currently net long 36.9k, down 9.7k.
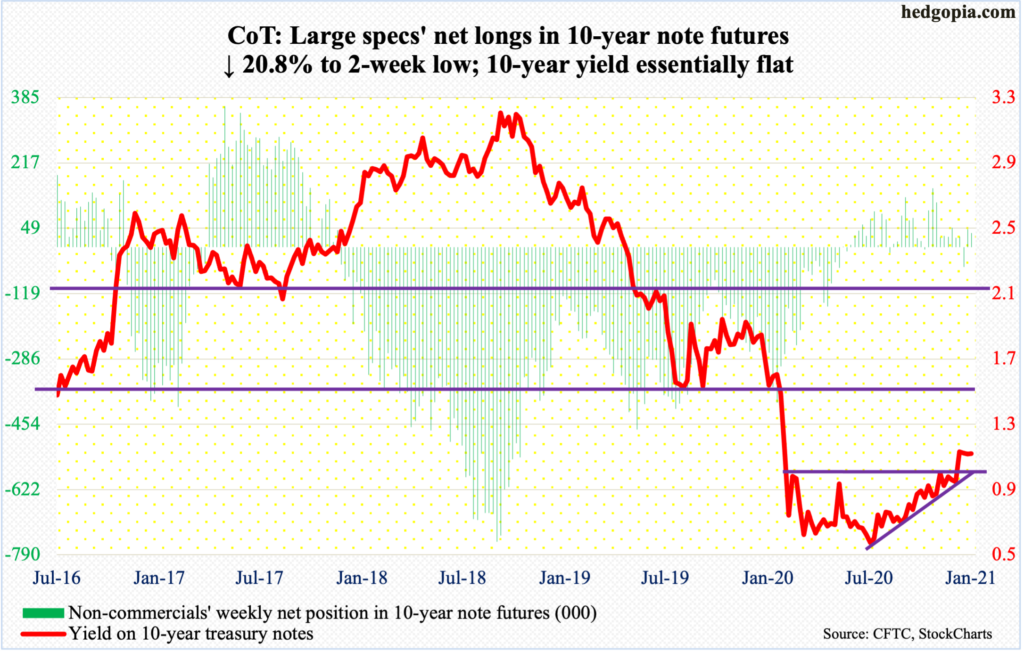
Wednesday’s intraday drop to one percent has so far been a successful retest of the breakout three weeks ago, when the 10-year treasury yield (1.09 percent) rallied past nine-month resistance just under one percent. Subsequently, rates reached 1.19 percent on the 12th before retreating.
If bond bears (on price) regroup in earnest and manage to sustainably push rates up, this will have come against the backdrop of a Fed that is aggressively accumulating mortgage-backed securities and treasury notes and bonds to the tune of up to $120 billion/month.
As a matter of fact, as soon as the 10-year took out one percent, several Fed officials, including Chair Jerome Powell and Vice Chair Richard Clarida, made it clear they intend to continue to buy these securities, essentially nipping the budding taper talk bud.
The jawboning seems to have worked. The central bank would not like rates to sustain higher, given how leveraged the economy is – be it federal, corporate or household. But at the same time, bond bears too have put their foot down where they needed to. It remains to be seen if they can withstand the power of the Fed’s balance sheet.
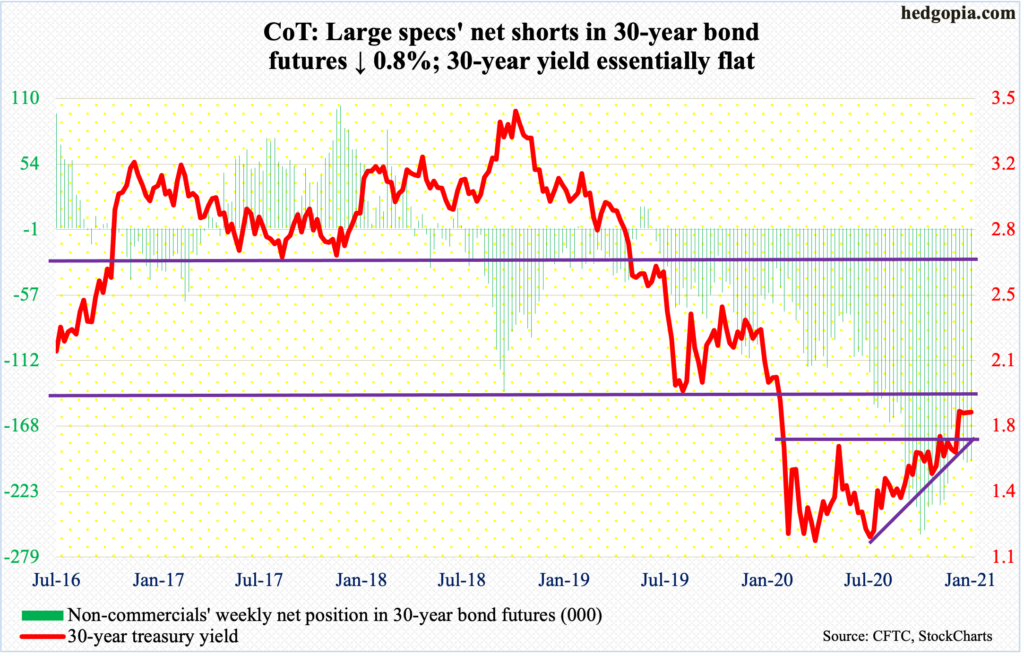
30-year bond: Currently net short 197.5k, down 1.6k.
Major economic releases for next week are as follows.
The ISM manufacturing index (January) comes out Monday. Manufacturing activity in December rose 3.2 points month-over-month to 60.7 – a 28-month high. In April, the index was down to 41.5.
The ISM non-manufacturing index (January) is published on Wednesday. Services activity increased 1.3 points m/m to 57.2 – a three-month high. In April, activity languished at 41.8.
Labor productivity (4Q20) and durable goods orders (December, revised) are due out Thursday.
Non-farm output per hour increased at an annualized rate of 4.5 percent in 3Q20.
Preliminarily, in the 12 months to December, orders for non-defense capital goods ex-aircraft – proxy for business capex plans – grew 8.4 percent to a seasonally adjusted annual rate of $71.8 billion – a new high. Growth progressively accelerated in the second half last year.
Friday brings employment data (January). Through December, from last February’s record high 152.5 million, there were still 9.8 million fewer non-farm jobs. Although from April’s low of 130.3 million, 12.3 million has been added.
WTI crude oil: Currently net long 542.5k, down 13k.
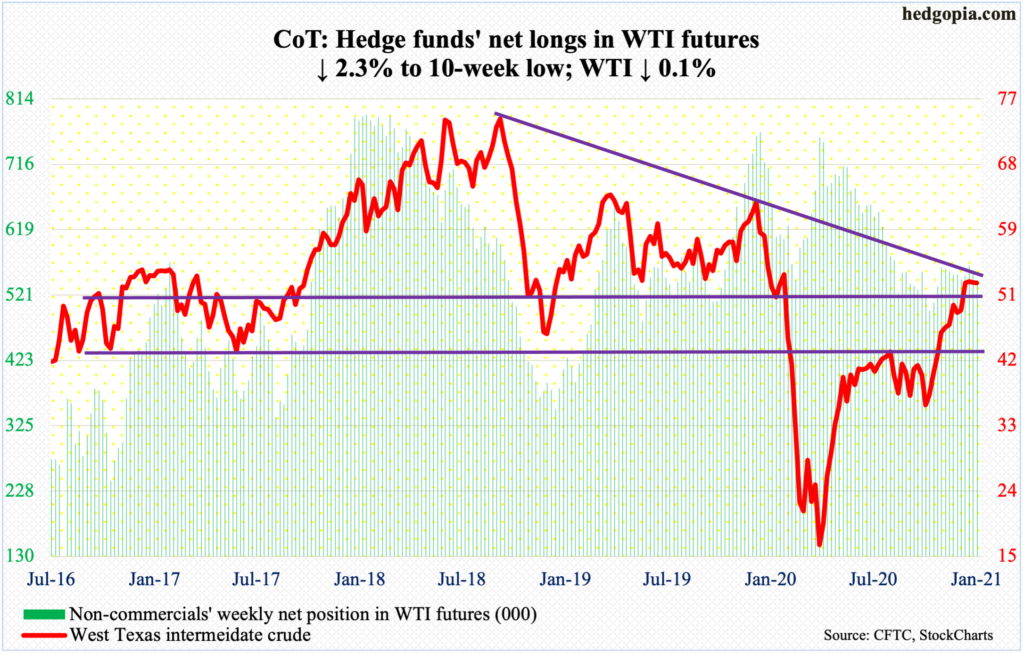
For the third week in a row, oil bulls struggled just north of $52. Since posting $53.93 intraday on the 13th, WTI ($52.20/barrel) has essentially gone sideways, with three weekly dojis. This preceded a breakout three weeks ago – out of horizontal resistance at $49-$50. Even before that, in late November, the crude took out $42-$43.
In recent weeks, bulls have been unable to build on that momentum. There are subtle signs of distribution. Risks rise if short-term support at $51.80s is breached, which opens the door to a breakout retest of $49-$50. The 50-day at $48.37 lies just below that.
In the meantime, after remaining unchanged at 11 million barrels per day for six straight weeks, US crude production fell 100,000 b/d. The data is as of January 22. The EIA report also showed crude imports dropped 981,000 b/d to 5.1 mb/d. As did stocks of crude and distillates – down 9.9 million barrels and 815,000 barrels to 476.7 million barrels and 162.8 million barrels respectively. Gasoline stocks, however, increased 2.5 million barrels to 247.7 million barrels. Refinery utilization declined eight-tenths of a percentage point to 81.7 percent.
E-mini S&P 500: Currently net short 28.4k, up 26.4k.
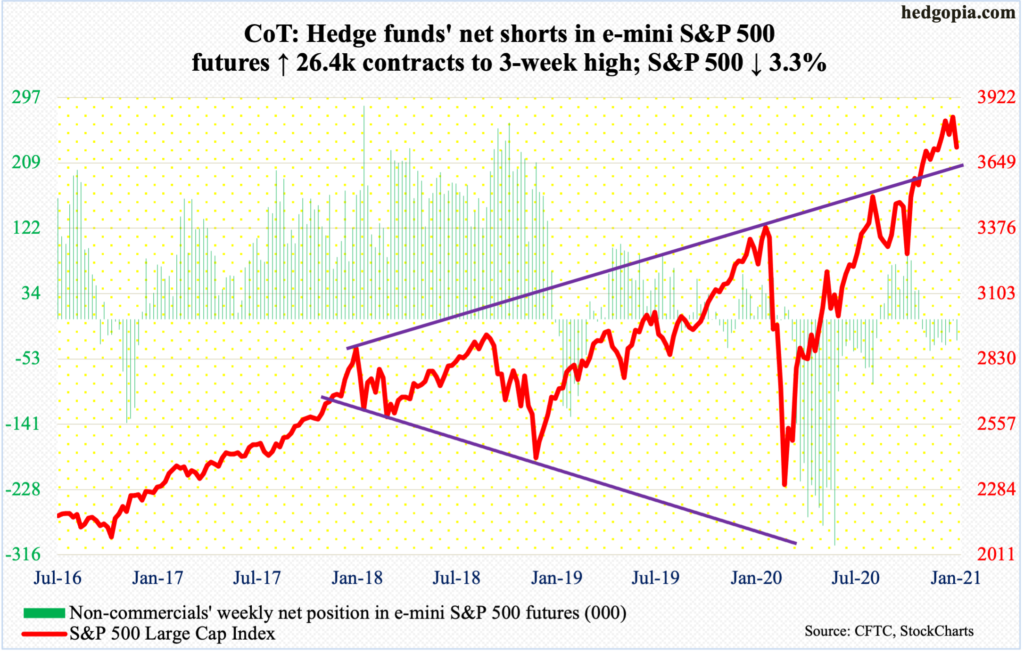
The latter sessions of January witnessed quite a reversal. Up until Tuesday when the S&P 500 posted a new all-time high of 3870.90, the month was up 3.1 percent. Then the rug pull happened. By Friday, the large cap index ended down 1.1 percent for the month.
This comes after rallying nearly 77 percent from the intraday low of last March. On the daily, action has been very erratic in recent sessions. Monday’s hanging man preceded back-to-back dojis last Thursday and Friday. This was then followed by Tuesday’s (this week) slight reversal after printing a new high. Then came Wednesday’s 2.6 percent drop. Thursday, the S&P 500 was up as much as 2.1 percent intraday but ended up only one percent, followed by Friday’s 1.9 percent decline.
The point is that the large cap index is showing signs of fatigue. The weekly and monthly in particular remain very extended, although in all fairness they have been that way for a while. Bears have an opportunity here. There are two levels in particular bulls will fight tooth and nail to save. A rising trend line from the March low extends to 3700, which is about where the 50-day moving average (3715.95) lies. The S&P 500 (3714.24) is sitting on this dual support. Then comes 3640s. On November 9, Pfizer (PFE) announced its positive vaccine news; the S&P 500 rallied initially but only to reverse and close 95 points lower from the intraday high of 3645.99. This level has a lot of memory attached to it.
Euro: Currently net long 165.3k, up 1.9k.
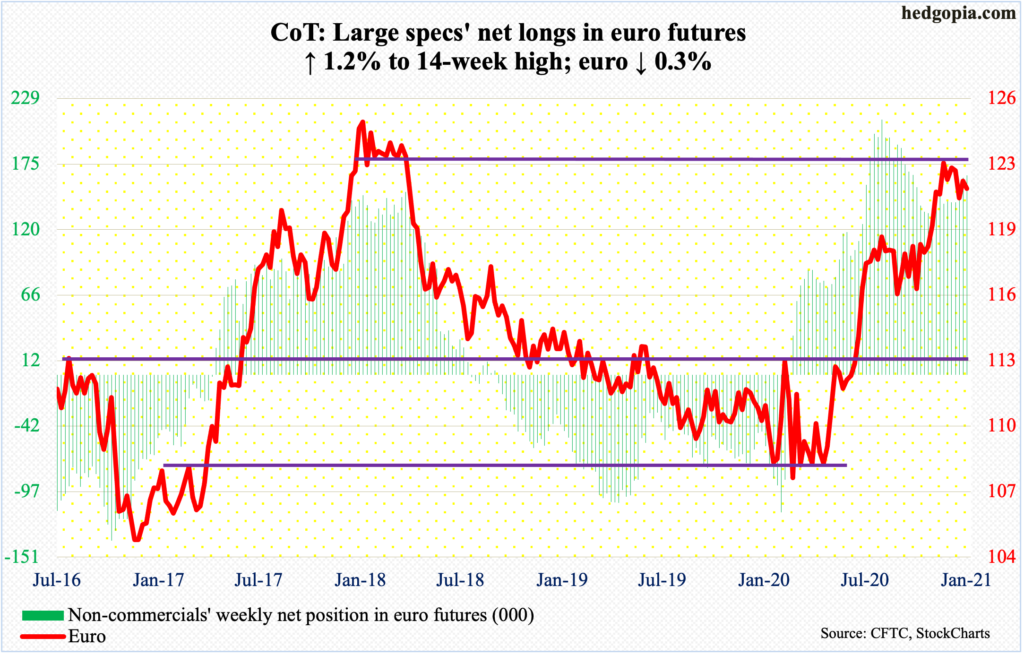
The euro ($1.2138) is in no man’s land – sort of. Bulls and bears have fought for control of the 50-day ($1.2124) for two weeks now. On Tuesday, bulls were unable to take out $1.2170s. One session later, bids showed up at the daily lower Bollinger band as the currency made an intraday low of $1.2059. Support at $1.20-$1.21 goes back more than 17 years and was reclaimed in early December. A breach likely exposes the currency to a quick test of the lower range of that support. Bulls’ odds improve if $1.2170s gives way.
Gold: Currently net long 257.5k, up 10.9k.
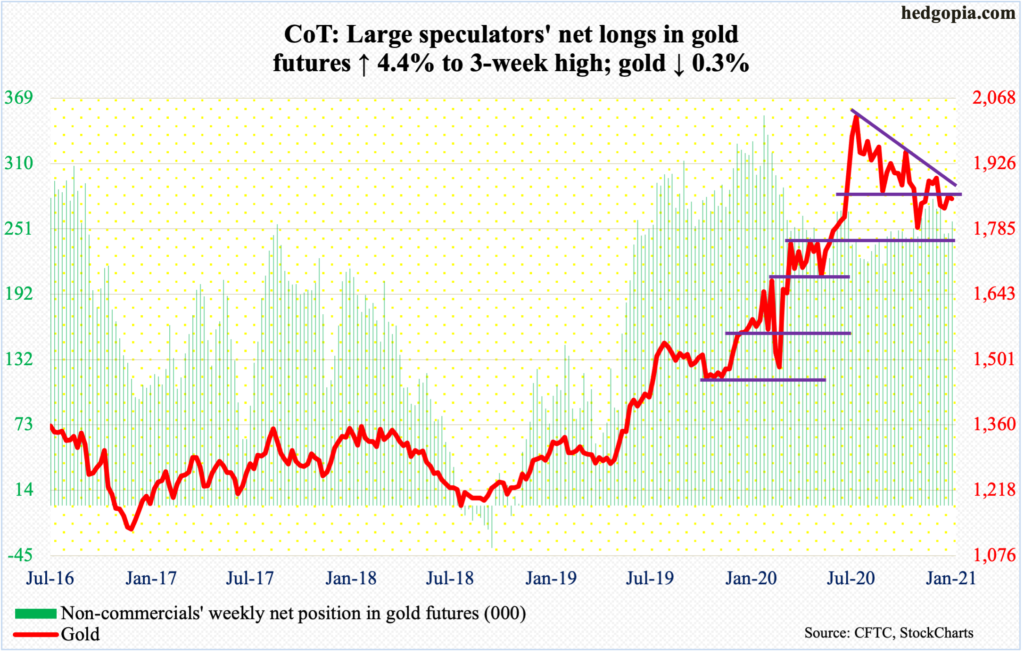
The 50- and 200-day ($1,859.07 and $1,851.57 respectively) are getting closer to a convergence. Gold ($1,850.30/ounce) has straddled the averages for three weeks now. The metal remains under crucial $1,920s, which is where it peaked in September 2011 but at the same time is above straight-line support at $1,760s-$1,770s.
Gold bugs can improve their odds should they manage to take out trend-line resistance from early August, which of late has consistently come in the way and which currently lies at $1,860s. Until that happens, risks remain to the downside.
Nasdaq 100 index (mini): Currently net long 39.7k, up 8.1k.
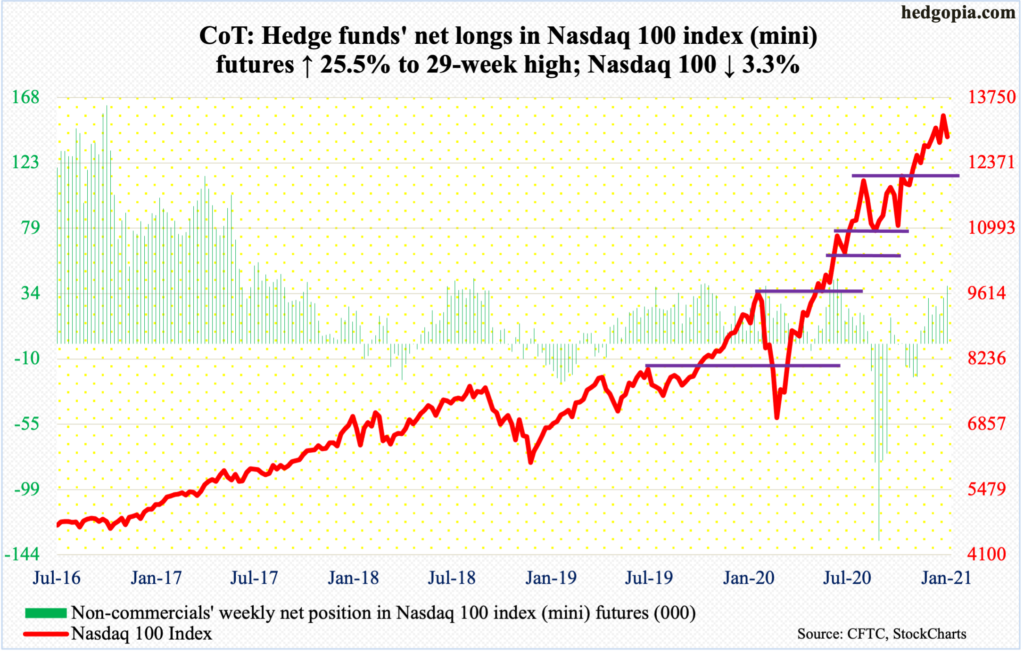
The Nasdaq 100 (12925.38) made a new intraday all-time high of 13563.70 on Monday but tech bulls were unable to hang on to the gains. January only ended up 0.3 percent with a monthly long-legged doji. On the weekly, despite having notched a new high, the index gave back 3.3 percent this week.
Of four of the top six US companies reporting this week, this is how the post-earnings reaction went: Microsoft (MSFT), essentially unchanged (unable to keep the intraday gains); Apple (AAPL), down; Tesla (TSLA), down; and Facebook (FB), down. Next Tuesday, Amazon (AMZN) and Alphabet (GOOG) report.
All these names have had massive rallies since they bottomed last March. Because they are so big (more on this here), they tend to have outsize influence on market cap-weighted indices such as the Nasdaq 100 or the S&P 500, which are beginning to act in an indecisive manner. This comes after having doubled since last March.
Ahead of this, as of mid-January, Nasdaq shorts were sitting on the highest short interest since mid-September 2008 (chart here). When it is all said and done, this can help form a bottom quicker as these shorts cover. But for now, it increasingly looks like they will be rewarded. The 50-day lies at 12680.55.
Importantly, the index closed out the week right on a rising trend line from last March. It is a must-save.
Russell 2000 mini-index: Currently net short 4.5k, up 4.9k.
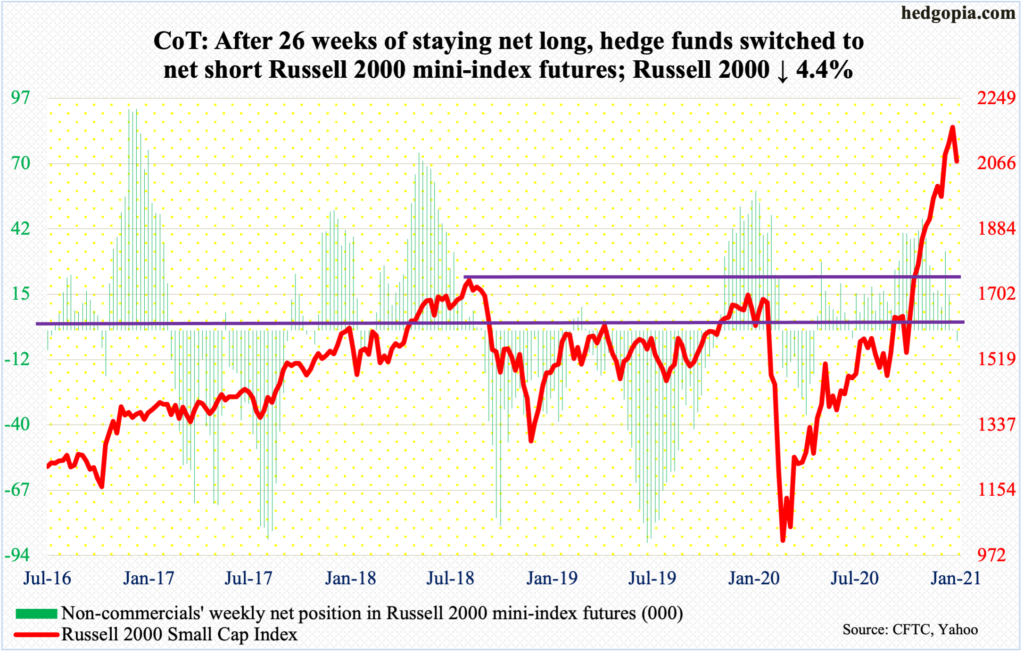
On Monday, the Russell 2000 posted a new intraday high of 2194.86 but only to reverse slightly lower and end with a long-legged doji. On IWM (iShares Russell 2000 ETF), in three of the eight sessions through Wednesday, the same pattern formed, with one other being a doji.
Both on the index and the ETF, the 10-day is rolling over. From late October/Early November, the small cap index (2073.64) rallied sharply within a channel, the low end of which is being tested currently. A decisive breach exposes the index to a drop to 2020s, and 1940s after that.
US Dollar Index: Currently net short 14.7k, up 442.
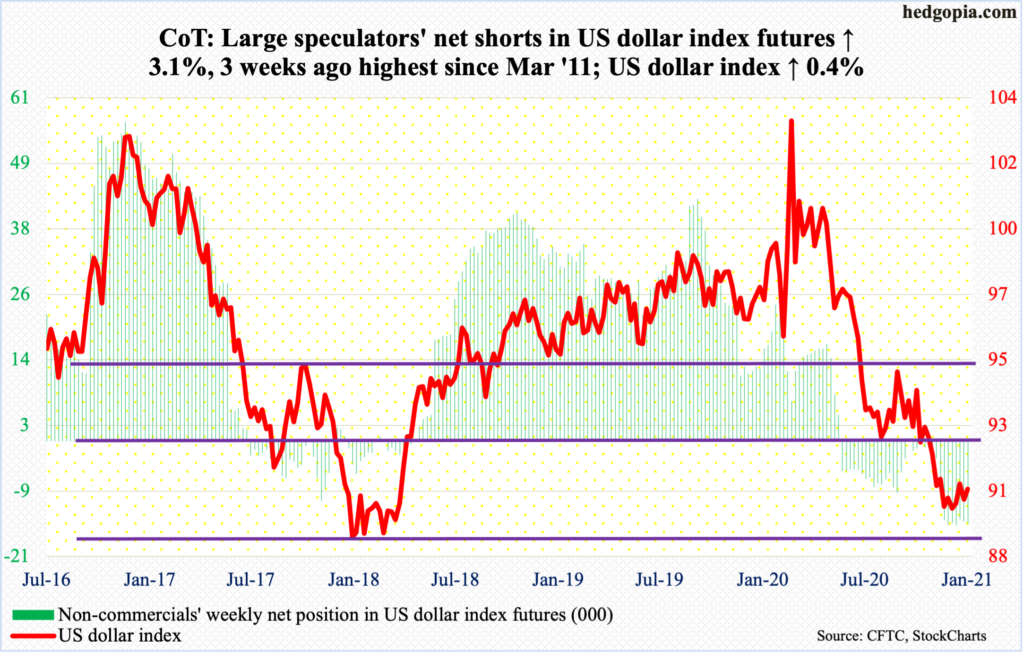
Horizontal resistance at 90.50s is proving tough to crack. As a matter of fact, in the latter three sessions this week, the US dollar index (90.57) reclaimed the level intraday, but the 50-day (90.68) came in the way. It has not been above the average since early November.
From dollar bulls’ perspective, the good thing is that 90 has provided support for three weeks now. This was preceded by an intraday drop to 89.17 on the 6th. Support at 88-89 goes back to at least March 2004.
It is only after 90.50s/50-day are recaptured can the bulls think about charging toward crucial 92, which they lost two months ago.
VIX: Currently net short 136.6k, up 12.2k.
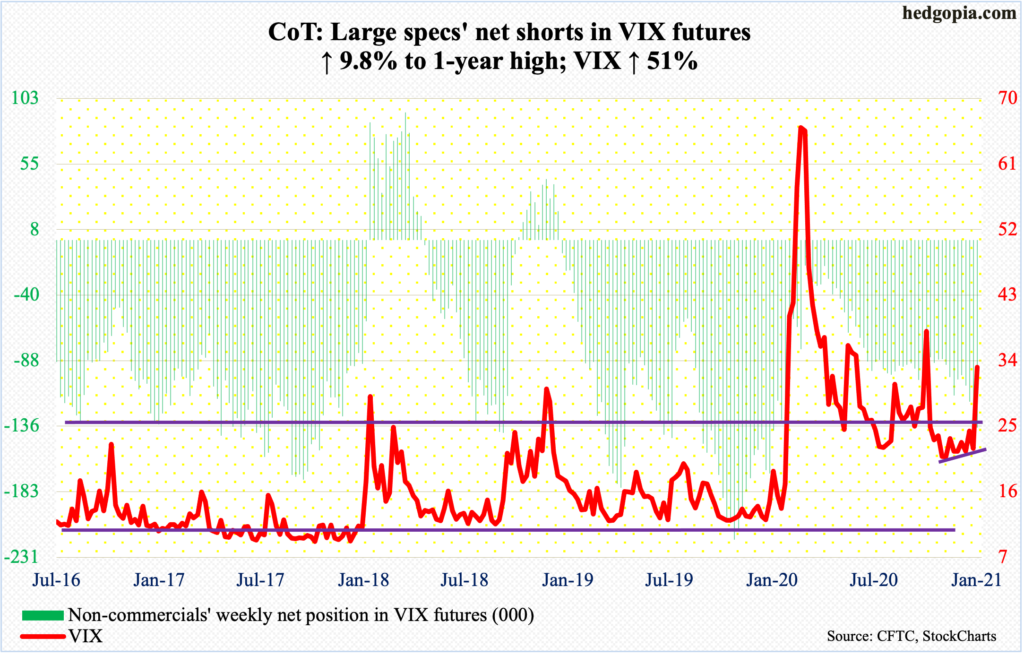
VIX surged 14.19 points on Wednesday to 37.21, which was the highest since November 2. Back then, the volatility index peaked on 41.16 on October 29. Intraday Friday, it then surpassed Wednesday’s high by tagging 37.51 but only to pull back and close at 33.09.
This week’s jump preceded persistent defense of low-20s the past couple of months. Volatility bulls also defended a rising trend line from late November.
Concurrently, VIX has found it difficult to sustain higher. After Wednesday’s jump, it dropped to 27.39 intraday in the very next session to test the 200-day (27.43).
So, it remains to be seen if this one is different. It deserves the benefit of the doubt so long as the index remains above mid-20s. Of note, the 50-day is beginning to curl up, even as the 200-day is flattish. On the weekly in particular, there is plenty of room for VIX to firm up.
Thanks for reading!
