
Following futures positions of non-commercials are as of Sep 9, 2025.
10-year note: Currently net short 858k, down 10.4k.
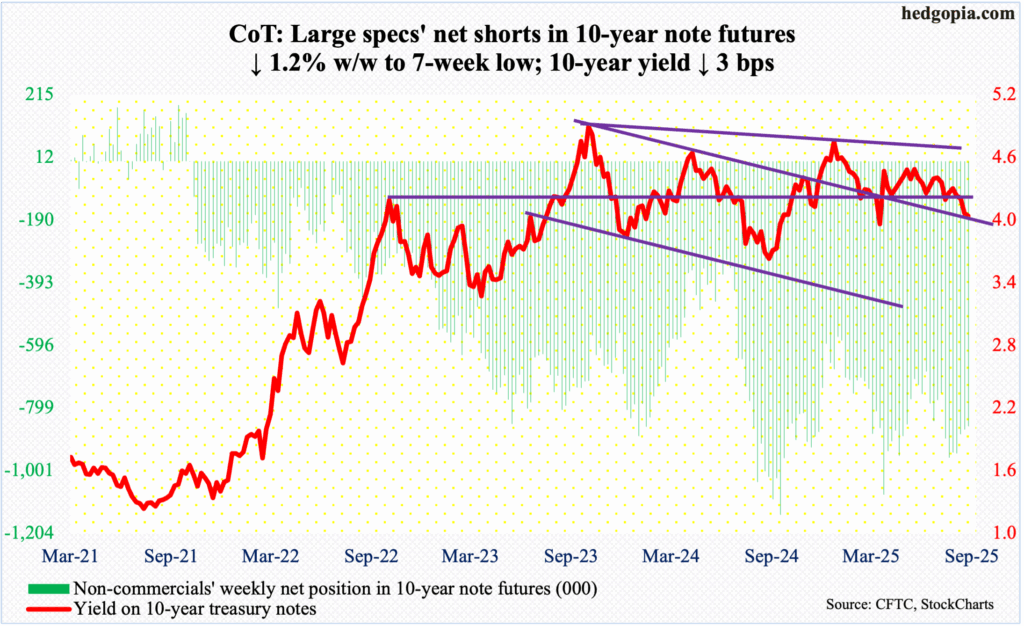
Next week, the FOMC meets. The two-day affair ends on Wednesday, and this will be the sixth meeting this year; two more remain after this. A 25-basis-point cut is priced in. The fed funds rate currently stands at a range of 425 basis points to 450 basis points, which has been there since December, when they eased by a full percentage point over three meetings, including a 50 last September.
After this, the futures market expects two more cuts this year – one each in October (28-29) and December (9-10), ending the year between 350 basis points and 375 basis points. Next year, three more 25-basis-point cuts are expected.
A lot has to go right for these traders if their bet on cuts of 150 basis points over the next 15 months were to come true. As things stand, the Federal Reserve has a tough job of maintaining the right balance between maximum employment and price stability, which make up its dual mandate. Jobs are showing signs of stagnancy/deceleration, even as inflation, although much lower from the four-decade highs of 2022, has been creeping higher the last few months. Core inflation is at/near three percent, versus the central bank’s two percent objective.
Next week’s meeting will also contain the quarterly summary of economic projections. With the Fed slated to be under a new leadership after Chair Jerome Powell retires next May, coupled with at least one new governor, the dot plot should generate a lot of interest.
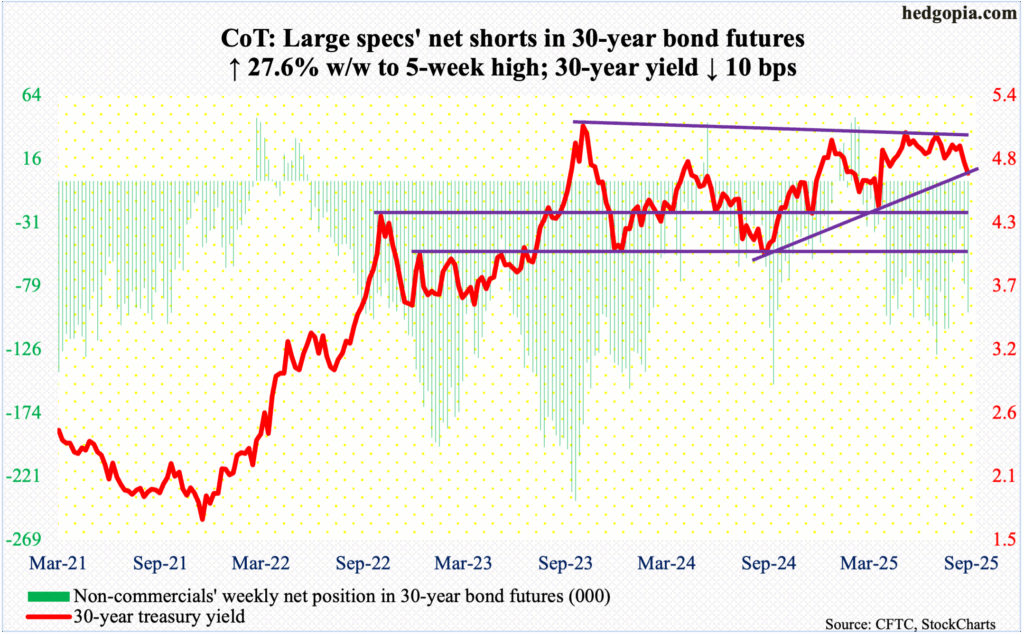
30-year bond: Currently net short 98.6k, up 21.3k.
Major US economic releases for next week are as follows.
Retail sales (August), industrial production (August) and the NAHB housing market index (September) are on schedule for Tuesday.
July retail sales grew 0.5 percent month-over-month to a seasonally adjusted annual rate of $726.3 billion, which set a fresh record.
Capacity utilization rose 0.3 percent m/m in July to 77.5 percent – a six-month low.
Homebuilder optimism decreased a point m/m in August to 32, matching a low of June, which established the lowest reading since December 2022.
Housing starts (August) will be reported Wednesday. Starts in July firmed up 5.2 percent m/m to 1.43 million units (SAAR) – a five-month high.
WTI crude oil: Currently net long 110.6k, down 15.3k.
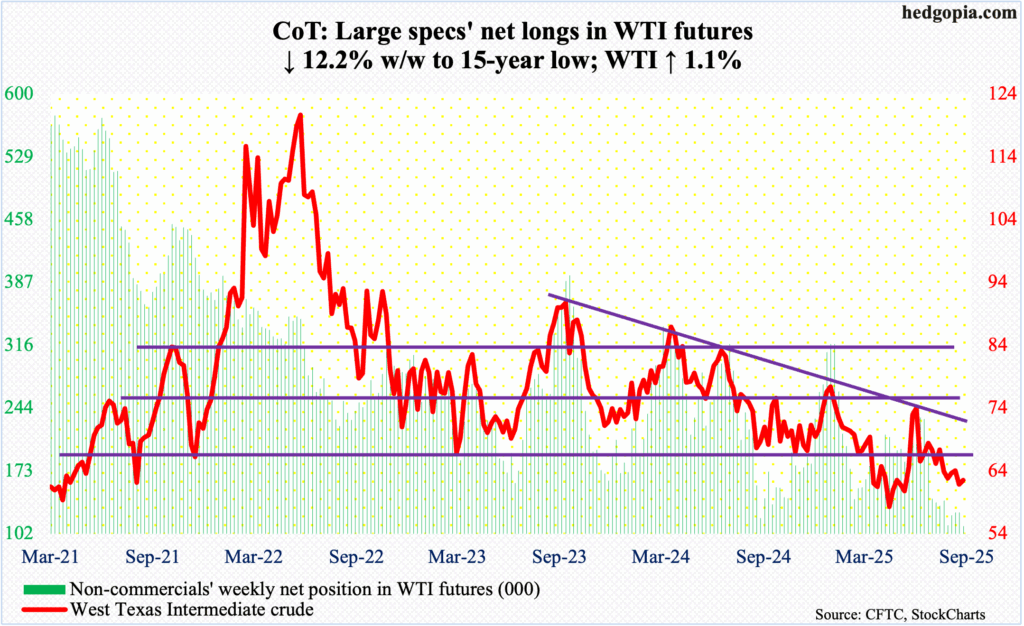
Last week, the 50-day moving average, which at the time approximated crucial horizontal support-turned-resistance at $65-$66, repelled rally attempts. This week, oil bulls could only rally West Texas Intermediate crude to Wednesday’s intraday high of $64.08, with the week up 1.1 percent to $62.55/barrel.
For a month now, oil bulls have defended $61-$62. This continued this week. On 9 April, the crude tagged $56.06 before bottoming. As things stand, no risk exists of a test of that low. Rather, the crude in the near term has room to rally toward the 50-day at $65.11.
In the meantime, US crude production in the week to September 5th increased 72,000 barrels per day week-over-week to 13.495 million b/d; output has come under slight pressure since registering a record 13.631 mb/d in the week to December 6th last year. Crude imports decreased 471,000 b/d to 6.3 mb/d. Stocks of crude, gasoline, and distillates were all up, respectively rising 3.9 million barrels, 1.5 million barrels and 4.7 million barrels to 424.6 million barrels, 220 million barrels and 120.6 million barrels. Refinery utilization grew six-tenths of a percentage point to 94.9 percent.
E-mini S&P 500: Currently net short 173.7k, up 12.6k.
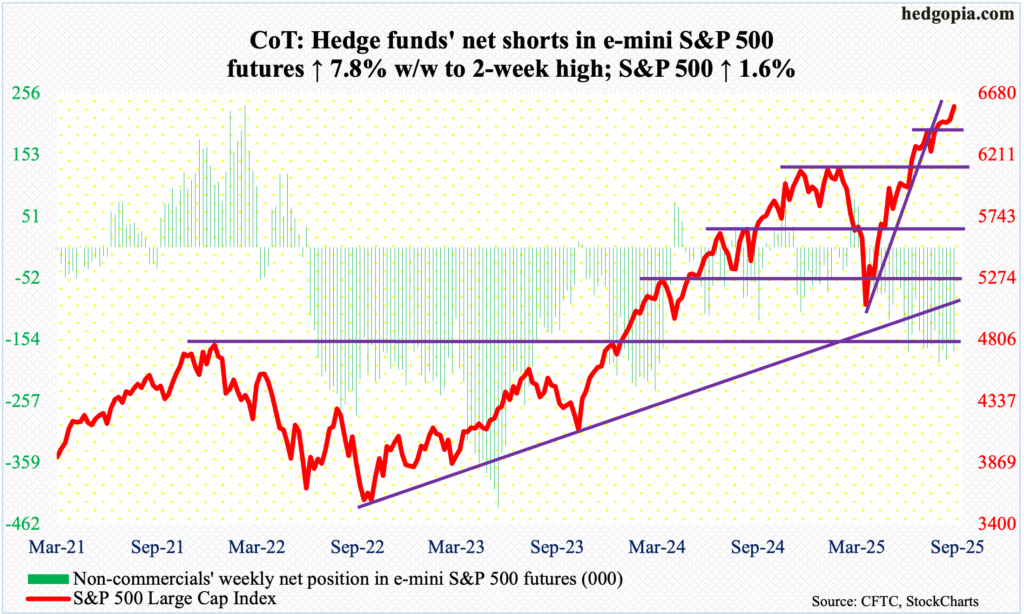
One more week and one more breakout on the S&P 500 – this time at 6480s, which for four weeks stopped equity bulls from gaining more ground. The large cap index bottomed at 4835 on 7 April. This week, 6480s gave way as early as Monday, rallying more as the week progressed. When it was all said and done, the week was up 1.6 percent to 6584, with a fresh intraday high of 6600 on Friday.
This was the fifth up week in six. All along, the weekly produced several potentially bearish candles – from a doji three weeks ago to a hanging man four weeks ago to a bearish engulfing candle seven weeks ago – but they never confirmed.
Bulls are simply running amok, defending support and keep hammering on resistance until it yields. The next line of support for them to defend lies at 6480s.
Euro: Currently net long 125.7k, up 6.1k.
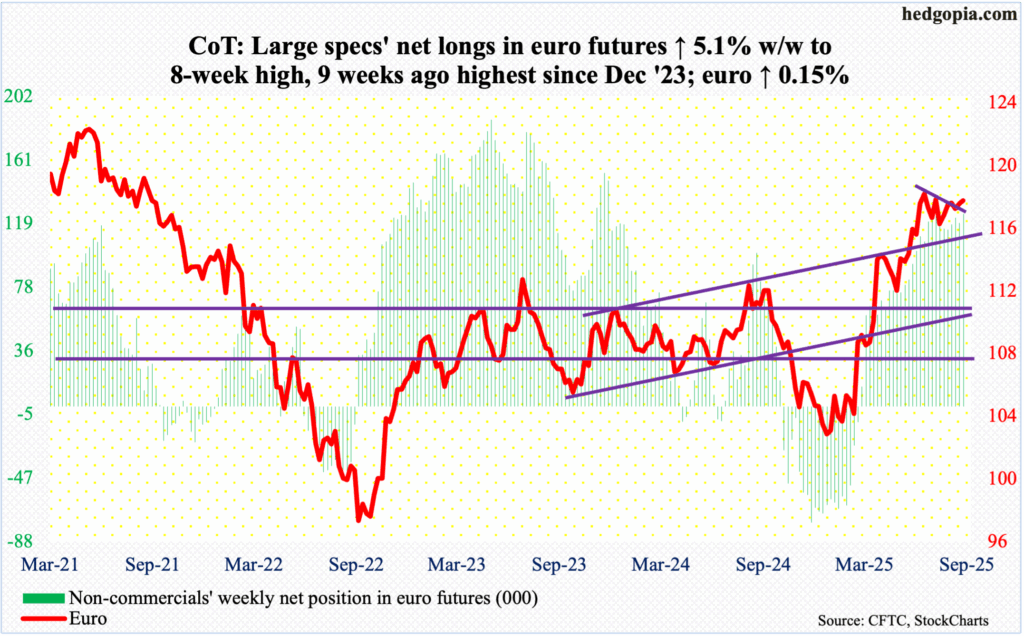
The euro continues to remain slightly north of a falling trendline from 1 July when it peaked at $1.183, having bottomed at $1.02s in January; at the same time, it has failed to build on the recent momentum. Six weeks ago, it closed at $1.164. This week, with the currency up in five of the last six weeks, it finished up 0.15 percent to $1.1735.
At this pace, the probability of a rally past the July 1st high is very low. That said, the euro remains above horizontal support at $1.16; bears will have to reclaim the level before regaining momentum.
Gold: Currently net long 261.7k, up 12.2k.
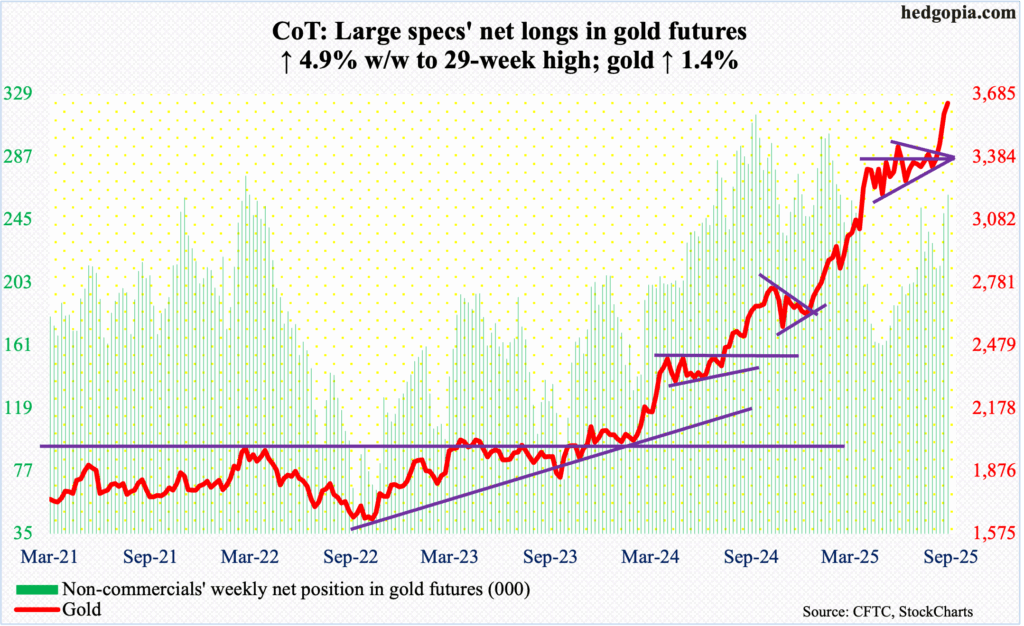
Gold continues to shine, rising 1.4 percent this week to $3,642/ounce. This was the fourth up week in a row. Last December, the metal tagged $2,596. The most recent momentum followed a symmetrical triangle breakout three weeks ago. The triangle consisted of several lower highs since reaching an all-time high of $3,500 on 22 April and several higher lows since mid-May when it ticked $3,121 intraday.
The April high of $3,500 should act as support next time gold comes under pressure. Technicals are way stretched, although positive momentum remains intact.
Nasdaq (mini): Currently net long 25.5k, up 10k.
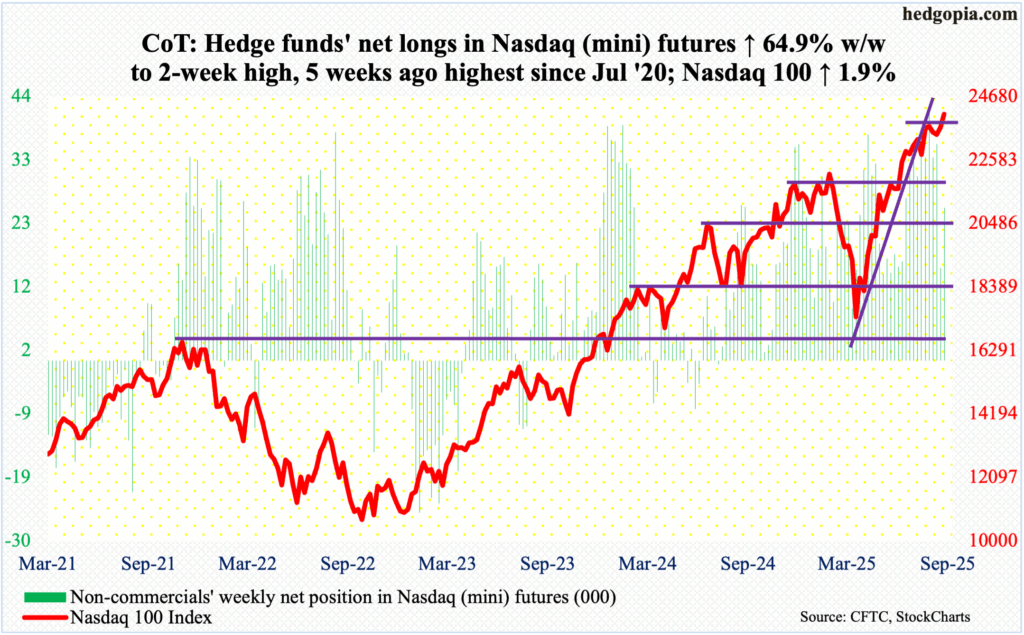
Going into this week, the Nasdaq 100, having bottomed at 16542 on 7 April, essentially went sideways for six weeks, with tech bulls unable to reliably push through 23600s. This week, the hurdle was no more; the index jumped 1.9 percent to 24092, with a new intraday high 24137 posted on Friday.
Most recently, the tech-heavy index bottomed on the 2nd at 22978, which at the time slightly undercut the rising 50-day (now 23336). That successful test of the average has now resulted in eight consecutive up sessions, with a fresh high.
For nearly a month, the Nasdaq 100 traded under the August 13th high of 23969, which has now been surpassed, albeit not by much. If the most recent rally is the result of lasting momentum, then tech bulls need to be able to defend 23900s in the sessions to come.
Russell 2000 mini-index: Currently net short 72.2k, up 11.9k.
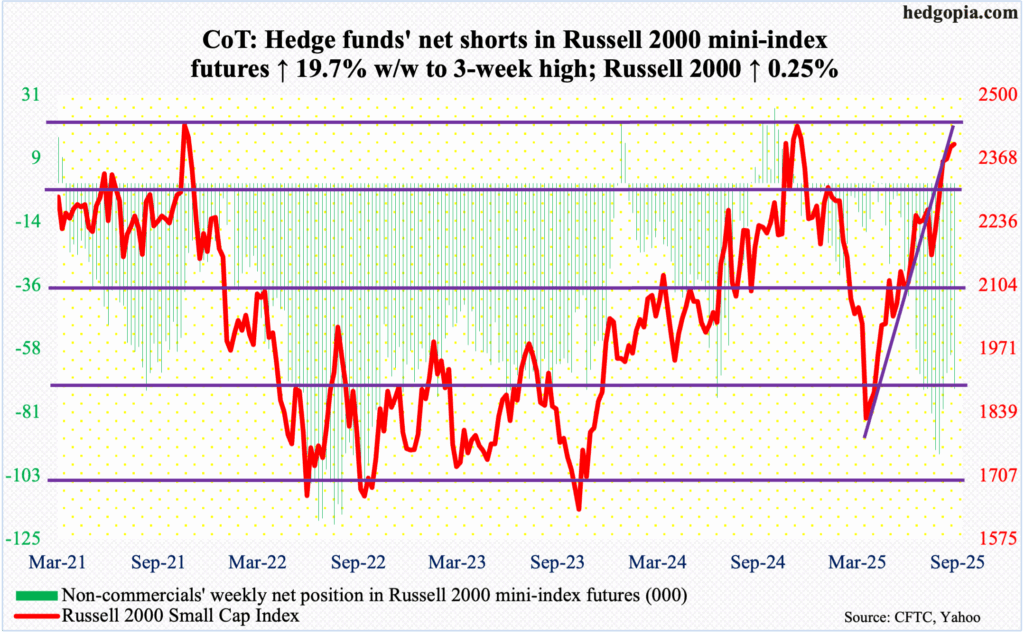
The Russell 2000 is inching ever closer to its all-time high of 2466 from last November. Three years prior to that, in November 2021, the small cap index retreated from similar levels when it ticked 2459. This week, it rallied as high as 2422 on Thursday, but only to end the week at 2397, still up 0.25 percent for the week.
Small-caps underperformed their large-cap cousins by a significant margin this week. It is possible buyers – both old and new – are getting nervous as the Russell 2000 approaches its prior highs. It has come a long way from 9 April when it bottomed at 1733. Alternatively, a triple top might form.
One thing to watch out for in the sessions ahead: a long-legged doji/spinning top developed on the weekly this week. This is not the first time these candles have formed since the April bottom. But last November when the index reversed lower, it did so with a weekly spinning top.
US Dollar Index: Currently net short 5.6k, up 537.
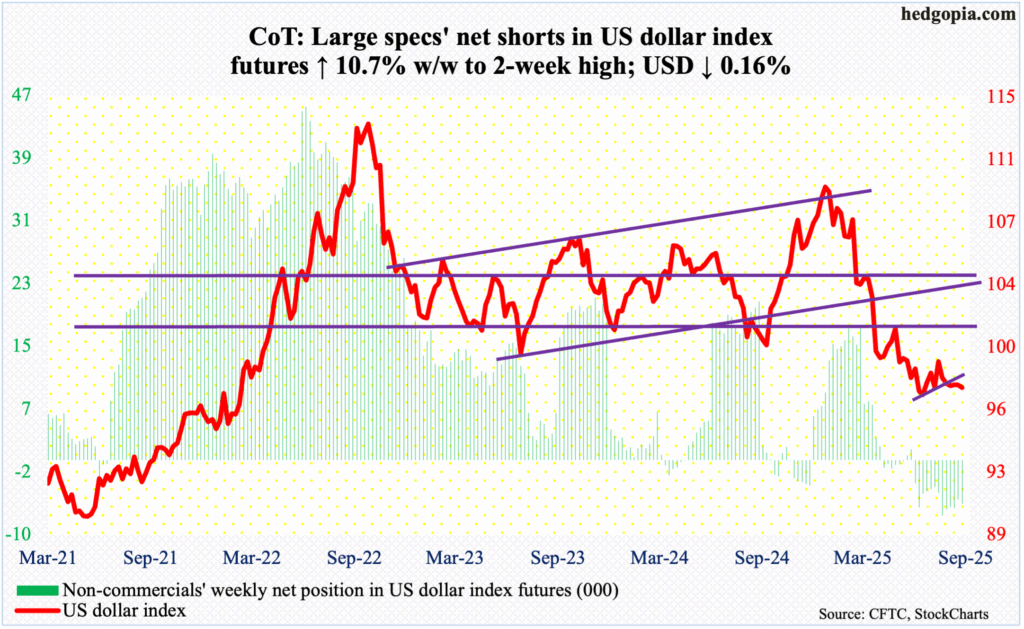
Having lost the 50-day last Friday, the US dollar index traded under the average in all five sessions this week, losing 0.16 percent to 97.61. This was the fifth down week in six, although the damage has been contained. Six weeks ago, it closed at 98.18.
The index has been under downward pressure for several months now, tagging 110.18 in January and reversing lower. On 1 July, it bottomed at 96.38. At least from the trading perspective, until this low gets taken out decisively, dollar bulls probably deserve the benefit of the doubt. There is also important trendline support around 97 which goes back to the lows of April and May of 2011.
This week’s close comes right at horizontal support at 97.60s.
VIX: Currently net short 107.8k, up 858.
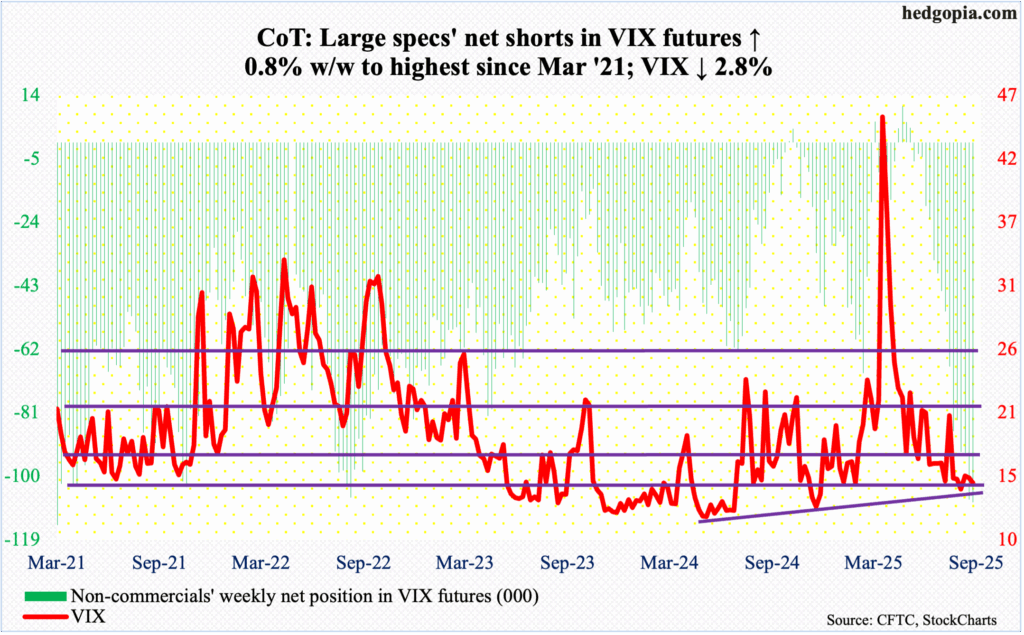
VIX is back at support at 14.50s-14.70s. This week, it shed 0.42 points to 14.76. In January and February this year, the volatility index found support there for several sessions before turning up. This was again the case on 29 and 31 July, with a few sub-15 readings before that; August was no exception. This month, VIX was rejected hard at/just above the 200-day as it ticked 19.38 on the 2nd, before turning lower to test the aforementioned support.
A decisive breach of 14.50s-14.70s, or 14, will raise the odds that VIX will eventually find its way toward 12-13. Non-commercials, in fact, seem to be betting that way. They are sitting on net shorts that are the highest since March 2021. Should 14 not yield, however, there will come a time when these traders will be tempted/forced to lock in their profit, and that will put upward pressure on volatility.
Thanks for reading!
