U.S. stocks had a very good week last week.
The S&P 500 large cap index rallied 2.3 percent, Dow Industrials 2.1 percent, both Nasdaq 100 index and Russell 2000 small cap index 3.4 percent, among others.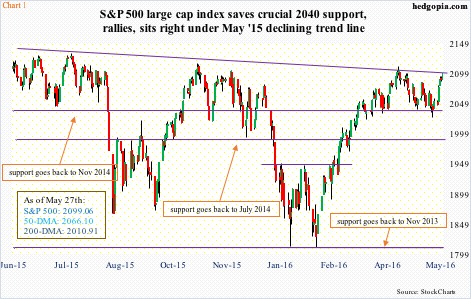
The rally comes in the wake of mild sell-off followed by defense of important support on each of these indices – 2040 on the S&P 500 (Chart 1), 4270-4350 on the Nasdaq 100, 1090-1120 on the Russell 2000, and 17200-17300 on the Dow.
The question du jour is, is there more to come? The short answer is, possibly yes.
Last week’s price action has given at least some level of momentum to stocks. There is room for weekly indicators on these indices to push further into overbought territory.
On the S&P 500, for instance, this is as good an opportunity as any for the bulls to try to test the May 2015 all-time high of 2134.72, which is merely 1.7 percent away. What could possibly drive this?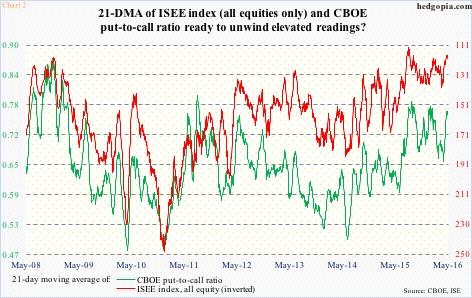
In the options market, put-to-call ratios are an effective tool to measure investor/trader sentiment. As is with other such tools, they can get extended – both ways.
In Chart 2, the CBOE put-to-call ratio and the ISEE index (equities only) are at such juncture currently. (The ISEE index is a call-to-put ratio, hence inverted). Both have just begun to head lower from elevated levels. Should this continue, this should act as a tailwind for stocks. Nevertheless, the straight CBOE put-to-call ratio last week was in 0.50s the past two sessions and in 0.60s in two more sessions before that, reflecting elevated optimism.
Barring that, the Nasdaq composite is showing some oomph. With one session to go in May, it is up 3.3 percent, versus 1.6 percent on the S&P 500. The ratio between the two has been rising in the past couple of weeks. It is too soon to declare it is a trend in the making, but as Chart 3 shows, there is plenty of room to rise.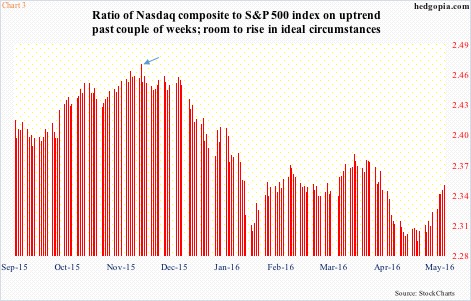
From the May 19th low, the S&P 500 is up 3.6 percent. This preceded a four-percent decline from April 20th through that low. During the same period, the Nasdaq gained 5.5 percent, preceded by a loss of 5.8 percent. So the rise in the ratio in Chart 3 could just be the Nasdaq making up for a bigger loss earlier. That said, the ratio is nowhere near where it stood just before stocks began to crater late December last year (blue arrow).
For this scenario to pan out, lots of things have to go right.
First, with the most recent rally, daily conditions are now extended on all these indices, and others – all sitting on/near the upper Bollinger Band. However, overbought can become more overbought, and this is precisely what the bulls are hoping for.
What could throw a monkey wrench into this scenario? The S&P 500, for instance, sits just underneath a declining trend line drawn from the May 2015 peak (Chart 1). If it takes out this resistance, then it has to deal with supply at/near 2111 (April 20th high) and after that 2135 itself.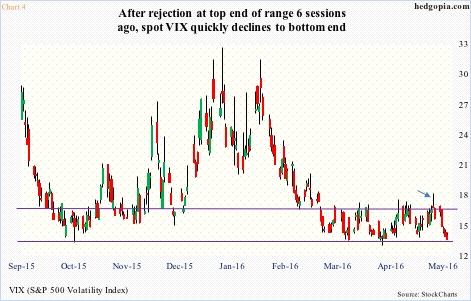
Second, on May 19th spot VIX’s rally attempt past 17 was vehemently rejected (arrow in Chart 4). Since that high, it quickly lost 4.5 points. Resistance at 16-17 goes back two decades. In the past, a break out of this range more often than not has followed a jump in volatility. Now that a breakout has been denied, the question is, how low can it go?
In 2005-2006, VIX was pushed all the way down to below 10, and to below 11 and 12 in 2013-2015. The last time it dropped below 11 was in August 2015. Since October last year, it has found support in the 12-13 range. Last Friday, it closed at 13.12.
So, for continued rally in stocks, VIX needs to go toward 12, maybe even 11.
What could throw a monkey wrench into this scenario? As pointed out earlier, the last time VIX fell below 12, as well as 11, was in August last year, just before a two-week, 11-percent drop in the S&P 500.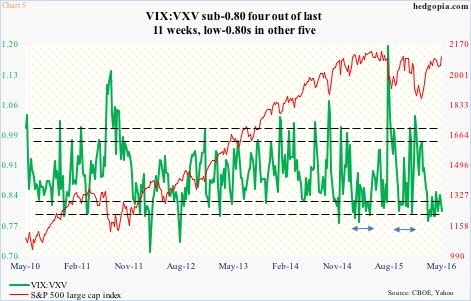
Third, the VIX-to-VXV ratio should continue to languish in low-0.80s/high-0.70s (Chart 5). In the March 14th week, the ratio dropped to 0.782 – a one-year low. Since then, there have been several attempts to bolt out of the oversold zone, but to no avail. Consequently, it has been stuck there for 11 weeks now, with four sub-0.80 and five in low-0.80s. These are suppressed readings, and have been that way for a while. Once again, oversold can remain oversold longer than one can imagine.
What could throw a monkey wrench into this scenario? Since February last year, there have been two other occasions in which VIX:VXV stayed suppressed for weeks (bi-directional arrows in Chart 5). In due course, a sharp rally followed both times.
Fourth, flows need to improve. One persistent theme in the current rally, and even the ones before this, has been a lack of retail participation – at least measured by flows into U.S.-based equity funds.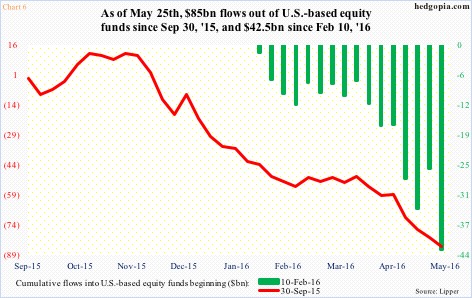
In the past eight months, there have been two powerful equity rallies. The one that began in September last year was good for 13 percent over five weeks and the one that began in February this year yielded north of 16 percent over nine weeks.
Ironically, since these rallies began, equity funds have lost money hand over fist – $85 billion since the week to September 30th last year and $42.5 billion since the week ended February 10th (Chart 6).
The hope is that last week’s action changes this drought. Alternatively, a possible new high on the S&P 500 excites enough on-the-sidelines money to jump on the rally bandwagon.
What could throw a monkey wrench into this scenario? The prevailing trend is anything but encouraging. Thus far, if not for corporate buybacks, it would be hard to sustain these rallies, which the retail crowd has taken advantage of to exit/lighten up on equities.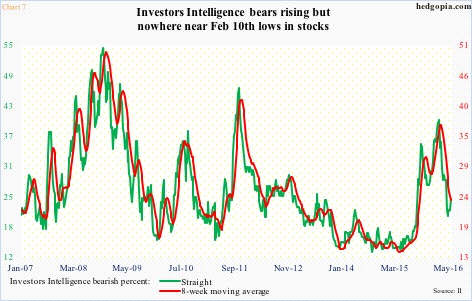
Fifth, despite major equity indices being near/at record highs, investor sentiment remains suppressed. Back on February 10th, Investors Intelligence bulls were 24.7 percent, rising to 47.4 percent on April 20th before dropping to 35.4 percent on May 25th. The last time bulls crossed 50 was in June last year.
Similarly, on May 25th, bears stood at 24 percent, up from 20.6 percent four weeks ago (Chart 7). The correction camp is rather large at 40.6 percent. For bulls’ count to rise, either bears, or those in the correction camp, need to shrink.
What could throw a monkey wrench into this scenario? Bulls have plenty of room to rise, but bears are not high enough to potentially set in motion a sustained rally.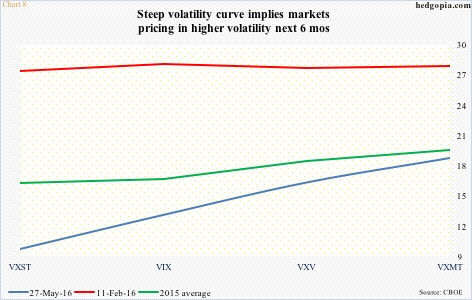
These are all near-term scenarios. Medium-term is different. The VXST (nine days)-VIX (30 days)-VXV (three months)-VXMT (six months) curve is telling us markets are pricing in higher volatility the next six months, with the spread last Friday between VXST and VXMT just under nine points (Chart 8).
The message? In whatever way things unfold near-term, medium-term can be rocky. This is probably what rather-subdued investor sentiment, range-bound spot VIX, and fund outflows are reflecting.
Thanks for reading!

