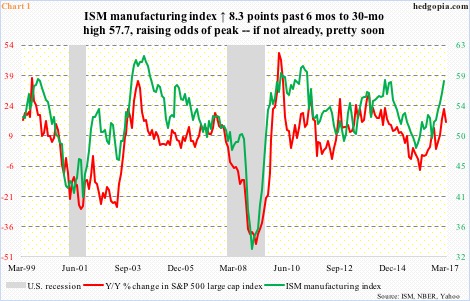
Chart 1 shows decent relationship between year-over-year change in the S&P 500 large cap index and the ISM manufacturing index.
U.S. manufacturing activity has picked up – from 49.4 last August to 57.5 in February. The 8.3-point six-month jump is the highest since December 2009 when the index rose 9.5 points over six months.
February’s reading is also the highest since 57.9 in August 2014. Back then, activity began to decelerate from that high. At present, nothing says it cannot continue higher. In fact, back in February 2011 activity began to soften after hitting 60. Nonetheless, with the index in high 50s already, each push higher raises the odds of a peak.
Plus, the likelihood of an additional push from both business and consumer right at this moment is not very high.
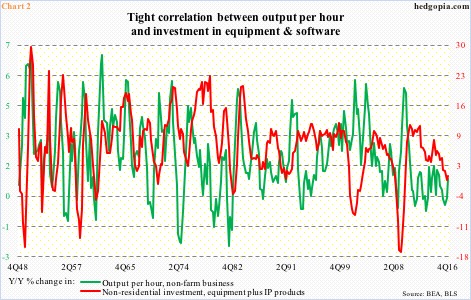
Consider business capital expenditures.
Nominal non-residential investment (equipment plus IP products) inched up 0.3 percent in 4Q16 to a seasonally adjusted annual rate of $1.83 trillion. Growth has persistently softened since logging 8.5 percent in 3Q14 (Chart 2). This impacts productivity, which is key to growth.
Post-November 8 presidential election last year, this has gotten a bit more complicated. President Trump has talked about plans to increase infrastructure spending, reduce regulations, and cut taxes. The carrot has been dangled, likely giving businesses a reason to wait before they take on major projects.
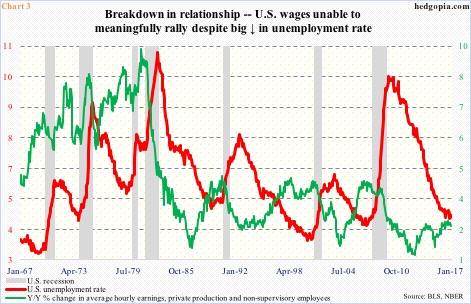
Over on the consumer side, Chart 3 is revealing.
The relationship between the unemployment rate and wages has essentially broken down. Unemployment reached 10 percent in October 2009, then dropped to 4.6 percent last November, before rising to 4.8 percent in January. This rapid drop has not been reciprocated by upward pressure on wages.
Wages have risen, but not to the extent desired. Four months short of completing eight years of recovery, year-over-over growth in average hourly earnings of private-sector production and non-supervisory employees is yet to crack three percent. The last time that occurred was May 2009 (3.1 percent), when Great Recession was on its last legs.
Here is the rub.
This is not likely to change anytime soon. Take the National Federation of Independent Business survey. In November through January, the optimism index surged 11 points to 105.9, which was the highest since 106.1 in December 2004. But during those three months, members’ compensation plans fell a point to 18.
Thus growing odds that the green line in Chart 1 peaks soon, if it has not already. As of March 1, the Atlanta Fed’s GDPNow model is forecasting 1Q17 real GDP growth of 1.8 percent, down from 1.9 percent in 4Q16 and 3.5 percent in 3Q16.
In this context, last week’s action in major U.S. indices could prove to be important – at least near term.
All four major indices – the S&P 500 large cap index, Dow Industrials, Nasdaq composite and the Russell 2000 small cap index – rose to fresh all-time highs, but were unable to hang on to all of the gains, in the end producing potentially reversal weekly wick.
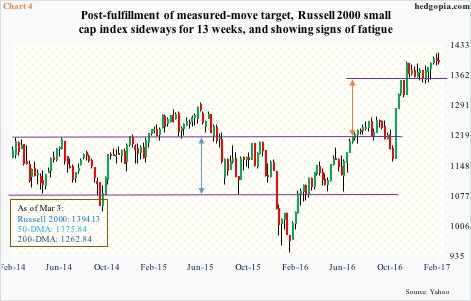
Action on the Russell 2000 in particular is noteworthy. Small-caps – inherently domestically focused – probably get the most bang for the tax-cut buck. Or, at least that is the prevailing investor/trader perception. At one point last week, the Russell 2000 was up 1.5 percent, but closed flat. This followed a breakout 12 weeks ago, and a subsequent sideways action. Last week’s candle has fatigue written all over it (Chart 4).
This comes at a time when non-commercials have been gradually cutting back net longs in Russell 2000 mini-index futures. Early January this year, they were net long 92.7k contracts, a record. By last Tuesday, this was cut down to 19.7k.
Early December last year, the Russell 2000 broke out of 1347, before going sideways just south of 1400. The index is still going sideways.
Hence the potential significance of last week’s candle. Immediately ahead, the level to watch is 1347; when it gets tested, the 50-day moving average would have been lost already.
On the S&P 500 (2383.12), immediate support lies at 2370, followed by 2280. For the index to get to the latter support, the green line in Chart 1 probably needs to turn lower – and it probably will.
Thanks for reading!

