Following futures positions of non-commercials are as of May 9, 2017.
10-year note: Currently net long 229.1k, up 49.2k.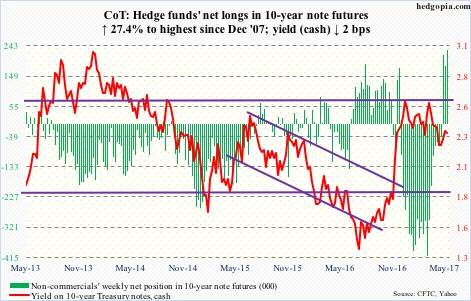
Back into the nearly six-month range … or near range support, to be precise.
Since the election last November, 10-year yields (2.34 percent) have been stuck between 2.62 percent and 2.31 percent. There was a brief support breach in the middle of April (dropped to 2.18 percent). Other than that, yields have been range-bound.
It is possible the support gets breached again.
The top end of the range is Janus Capital’s Bill Gross’s make-or-break – in that he thinks a breakout would end the multi-decade bull market in bonds. Thus far, it has been tested twice – last December and March this year – and both were unsuccessful.
In both those months, the Fed hiked by 25 basis points.
In the futures market, the odds of a 25-basis-point rise in June (13-14) currently stand at 79 percent – pretty much a lock. In view of this, the inability of 10-year yields to rally and at least test the range top is revealing.
What are the odds of the prevailing rally extending that far? Not good. Not in the very near term, anyway.
On the daily chart, yields just kissed the upper Bollinger band, and seem to be wanting to go lower. The 50-day moving average was lost Friday, having tagged intraday range support. Risk is to the downside.
Non-commercials are ready for it – having raised net longs to the highest since December 2007.
30-year bond: Currently net long 5.2k, down 4k.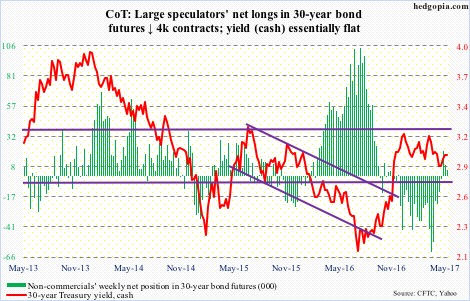
Major economic releases next week are as follows.
The NAHB housing market index (May) and the Treasury International Capital (March) are published on Monday.
Builder sentiment fell three points month-over-month in April to 68. March’s 71 was the highest since 72 in June 2005.
China held $1.06 trillion in Treasury securities in February. This is slightly up from $1.05 trillion last November but way down from record $1.32 trillion in November 2013. That nation has also relinquished the largest holder title to Japan, which held $1.12 trillion worth in February.
Tuesday brings housing starts (April) and industrial production (April).
Starts slid 6.8 percent m/m in March to a seasonally adjusted annual rate of 1.22 million units. The cycle high 1.32 million units was reached last October – which was the highest since 1.33 million units in August 2007.
March industrial production rose 1.5 percent year-over-year. This was the third up month in last four after 20 consecutive months of contraction.
Crude oil: Currently net long 379.8k, down 27.5k.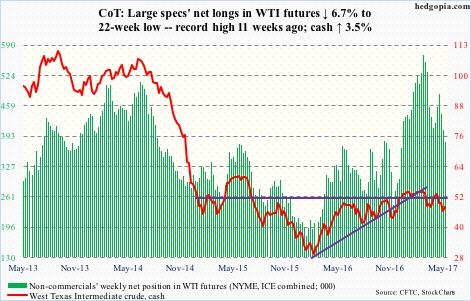
Wednesday’s EIA report was just what oil bulls needed. Spot West Texas Intermediate crude ($47.84/barrel) in that session rallied 3.2 percent to $47.33 – just past near-term resistance at $47.
Recall that last Friday the crude reversed higher after dropping to $43.76 intraday to test support at $42-$43.
Both 50- and 200-day moving averages lie above, with the latter offering resistance at $49.20. This is followed by the 50-day at $49.65.
The EIA report showed that crude stocks for the week ended May 5 were down 5.2 million barrels to 522.5 million barrels. This was the fifth straight week-over-week drop since reaching a record 535.5 million barrels five weeks ago.
Gasoline and distillate stocks dropped, too – down 150,000 barrels to 241.1 million barrels and down 1.6 million barrels to 148.8 million barrels, respectively.
As well, crude imports fell 644,000 barrels per day to 7.6 million b/d – an eight-week low.
Crude production, on the other hand, rose 21,000 b/d to 9.3 mb/d. Since OPEC reached a cutback agreement late November last year, U.S. crude production has increased by 615,000 b/d.
Refinery utilization fell 1.8 percentage points w/w to 91.5.
E-mini S&P 500: Currently net long 85.1k, down 6.4k.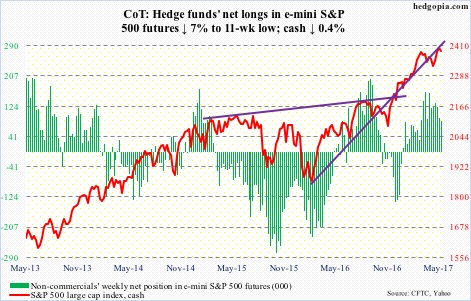
Yet another high on the cash (2390.90). Rallied to 2403.87 intraday Tuesday before getting repelled near the prior March 1 high of 2400.98.
The 10-day moving average which provided support for several sessions last week and this week is now flat. As is the 50-day below, which likely gets tested. For the first time since April 19, the index closed below the 10-day.
Flows are not helping much.
Following outflows of $3.7 billion in the prior week, U.S.-based equity funds lost another $2.1 billion in the week to Wednesday (courtesy of Lipper).
In the same week, $2.5 billion was withdrawn from SPY, the SPDR S&P 500 ETF, (courtesy of ETF.com). This followed outflows of $3.9 billion in the prior week.
Euro: Currently net long 22.4k, up 24.1k.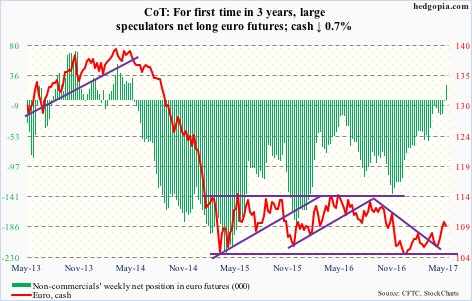
Thursday, the European Commission raised 2017 euro-area growth forecast from prior 1.6 percent to 1.7 percent; next year, the 19-nation economy is expected to grow 1.8 percent. One day earlier, Mario Draghi, ECB president, said the time has not yet come to think about QE exit.
Beginning April, the bank has been purchasing securities worth €60 billion every month, down from prior €80 billion.
The currency must be confused as to which variable to assign more weight to – higher growth or continued stimulus.
For now, leading into last Sunday’s French election, it rallied 6.4 percent this year. Unwinding some of these gains is likely near term. But euro bulls defended the 200-day moving average Thursday.
Non-commercials, in the meantime, switched to net longs – first time in three years.
Gold: Currently net long 150k, down 39.6k.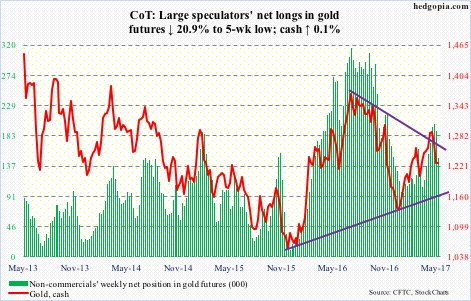
The cash ($1,227.7) is generating no investor interest at the moment.
In nine sessions through Wednesday, GLD, the SPDR gold ETF, saw activity only once – that of redemptions of $46.8 million on Monday (courtesy of ETF.com).
This is reflected in how the metal is trading – essentially flat this week.
Action near term likely gets decided by if daily or weekly conditions prevail, with the former oversold and the latter still overbought. If daily wins, gold bugs face resistance at 50- and 200-day moving averages ($1,246.74 and $1,252.56, respectively).
Nasdaq 100 index (mini): Currently net long 94.5k, down 11.3k.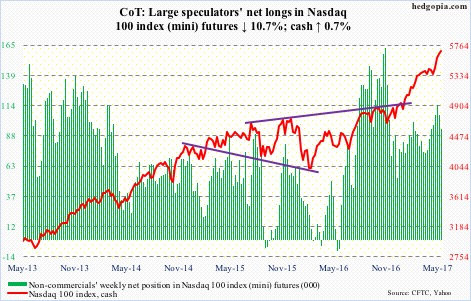
Tuesday scored a new intraday high of 5691.21 on the cash (5686.81). The tech-heavy index continues to outperform its major U.S. peers.
The index remains insanely overbought, but momentum is intact.
In due course, a retest of the April 20 breakout is possible – even necessary – and it is 4.5 percent away. This also approximates the 50-day moving average.
In the week ended Wednesday, QQQ, the PowerShares Nasdaq 100 ETF, gained $40 million. This followed inflows of $1.7 billion in the prior two weeks (courtesy of ETF.com).
Russell 2000 mini-index: Currently net short 40.1k, up 27.9k.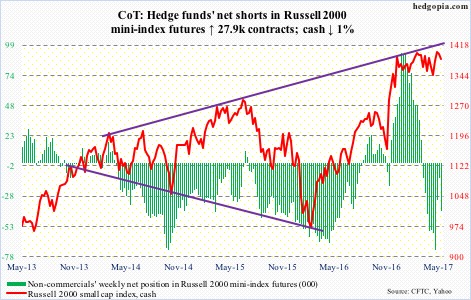
The cash’s rally attempt this week was essentially stopped at the falling 10-day moving average. Come Thursday, the 50-day – slightly dropping to flat – was tested, drawing dip buyers. The average was tested again Friday. As things stand, bears have the ball.
The index (1382.77) continues to trade within a five-plus-month range – between 1390s and 1340s. Either way it breaks, repercussions will be massive. Thus far, there have been two false breakouts.
In the week ended Wednesday, IWM, the iShares Russell 2000 ETF, lost $1.2 billion. This followed inflows of $3.2 billion in the prior couple of weeks (courtesy of ETF.com).
US Dollar Index: Currently net long 35.7k, down 4.3k.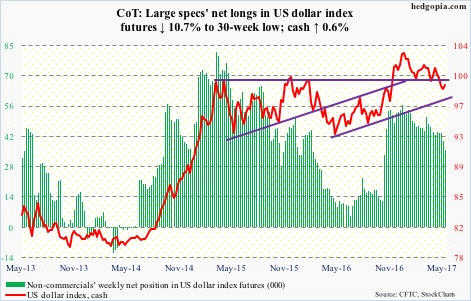
The cash (99.13) managed to retake the 200-day moving average.
That said, three weeks ago, the dollar index lost a rising trend line from last May, the underside of which provided resistance Thursday. If this is won over, there is resistance around 100.5, which represents a declining trend line from early this year.
Non-commercials continue to shy away, having cut net longs to a 30-week low.
VIX: Currently net short 115.7k, up 9k.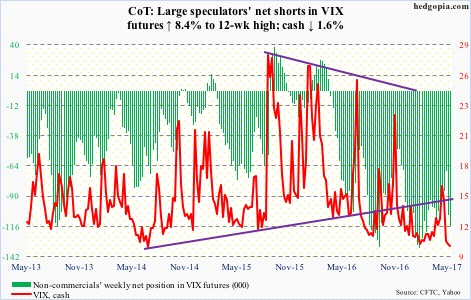
The cash (10.40) had a back-to-back sub-10 close on Monday and Tuesday. Prior to this, throughout its 27-year history, VIX closed in single digits only nine other times. (The all-time low of 8.89 was recorded on December 27, 1993.)
Here is an encouraging fact for volatility bulls. In each of those nine instances, VIX was higher one or three or six months later.
As things stand, the daily MACD seems to be on the verge of a bullish crossover. And the 10-day moving average is curling up, although the 20-day is still dropping, and may take some time before it does that. Bulls first need to be able to defend the 10-day.

