
Ahead of Wednesday’s March CPI and after a nice two- to three-week rally, sellers show up at important resistance on major US equity indices. With the daily in overbought territory, the bias is to the downside near term.
Trader expectations for fed funds futures continue to vacillate. After last Friday’s better-than-expected jobs numbers for March, the probabilities for a 25-basis-point hike in May (2-3) increased to 71 percent (currently 63 percent). These traders expect this to be the last hike of the current tightening cycle.
The benchmark rates lied between zero and 25 basis points when the Federal Reserve began hiking in March last year. After a year, the fed funds rate is now in a range of 475 basis points to 500 basis points. Futures traders believe that the central bank will then pivot right away and begin to lower rates by July, ending the year between 425 basis points and 450 basis points. Their rate expectations are probably way too optimistic versus where the Fed thinks rates are headed.
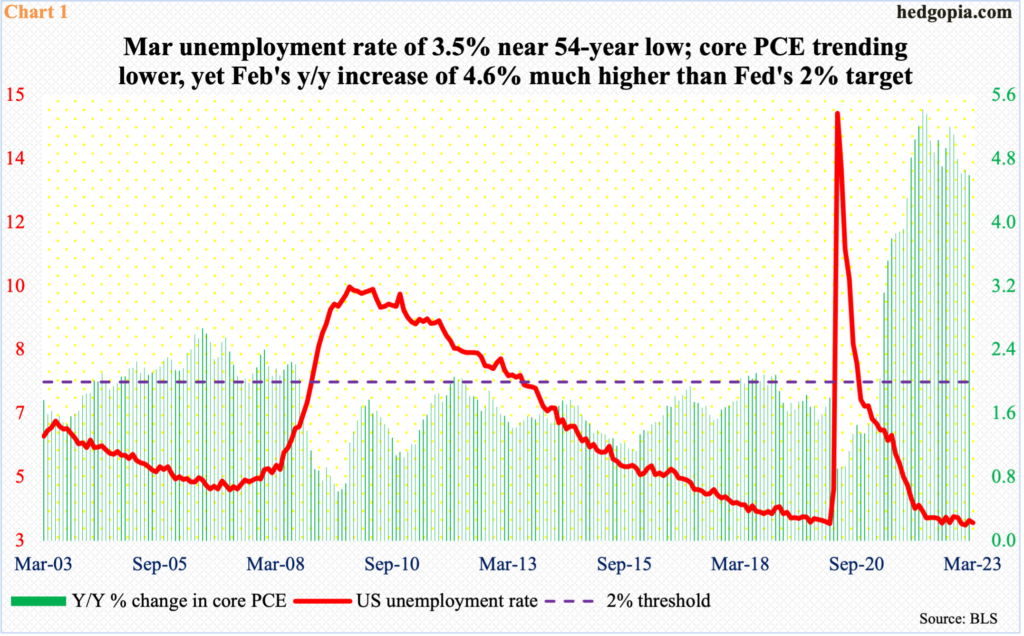
In March, the US economy produced 236,000 non-farm jobs, slightly better than the 230,000 consensus. Importantly, the unemployment rate inched lower one-tenth of a percentage point month-over-month to 3.5 percent – not too far away from January’s 3.43 percent which was the lowest since May 1969. Employment makes up one side of the Fed’s dual mandate coin.
The other side is inflation. And it remains way above the Fed’s two-percent objective.
In the 12 months to February, core PCE (personal consumption expenditures) – the Fed’s favorite inflation metric – rose 4.6 percent, which is lower than the cycle peak 5.4 percent in February last year but remains elevated (Chart 1).
The central bank rightly is doggedly focused on bringing inflation down to a desired level. Markets in all probability are underpricing the risk of the fed funds rate ending the year much higher than currently priced in. Several FOMC officials – including Chair Jerome Powell – have repeatedly made it clear that there would be no rate cuts this year, with the FOMC dot plot expecting a terminal rate of 5.1 percent, which is where the fed funds rate will be after a 25-basis-point hike in May.
This Wednesday, the CPI for March comes out. And it is likely to be a market-moving event. Ahead of this, major US equity indices are seeing sellers begin to show up at crucial resistance.
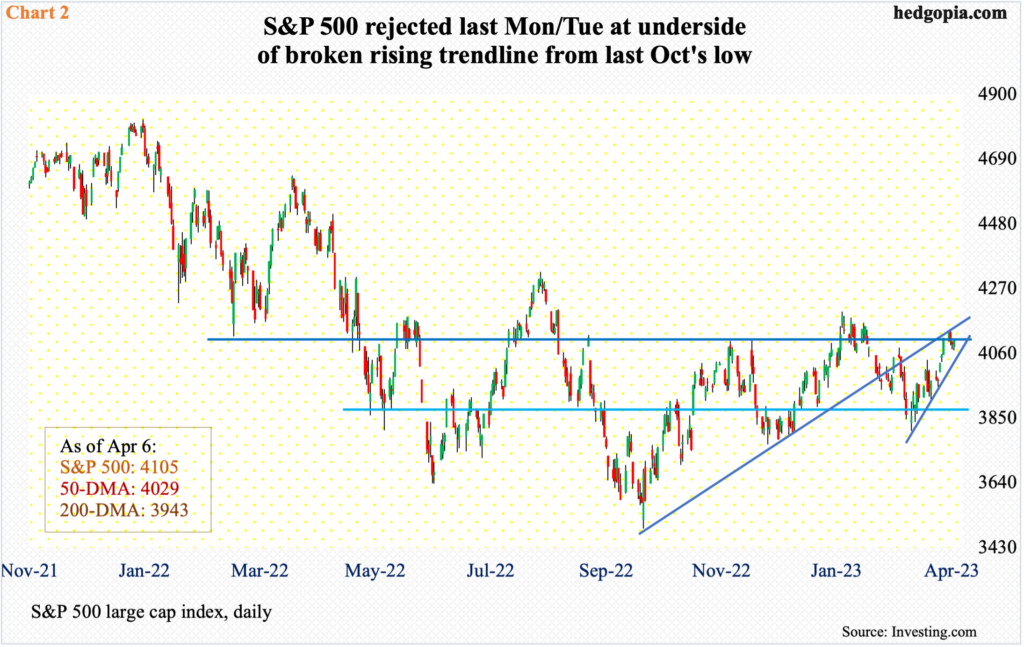
Last week, the S&P 500 inched down 0.1 percent to 4105; at Tuesday’s high 4133, it was up 0.6 percent, but bulls were unable to hang on to it. Last week’s weekly doji candle showed up after the large cap index rallied 6.4 percent in the prior three.
Sellers showed up at the underside of a broken rising trendline from last October when the S&P 500 bottomed at 3492 (Chart 2). Earlier, in the prior week, the index pushed past months-long horizontal resistance at 4100. The breakout did not amount to much as the bulls almost immediately were made to defend it.
Once it drops out of the wedge it is in, the index can hurriedly hurtle toward the lower horizontal support at 3900. Should things evolve this way, the 50-day moving average will have been lost and the 200-day (3943) will come into play.
There is room for the daily to come under pressure.
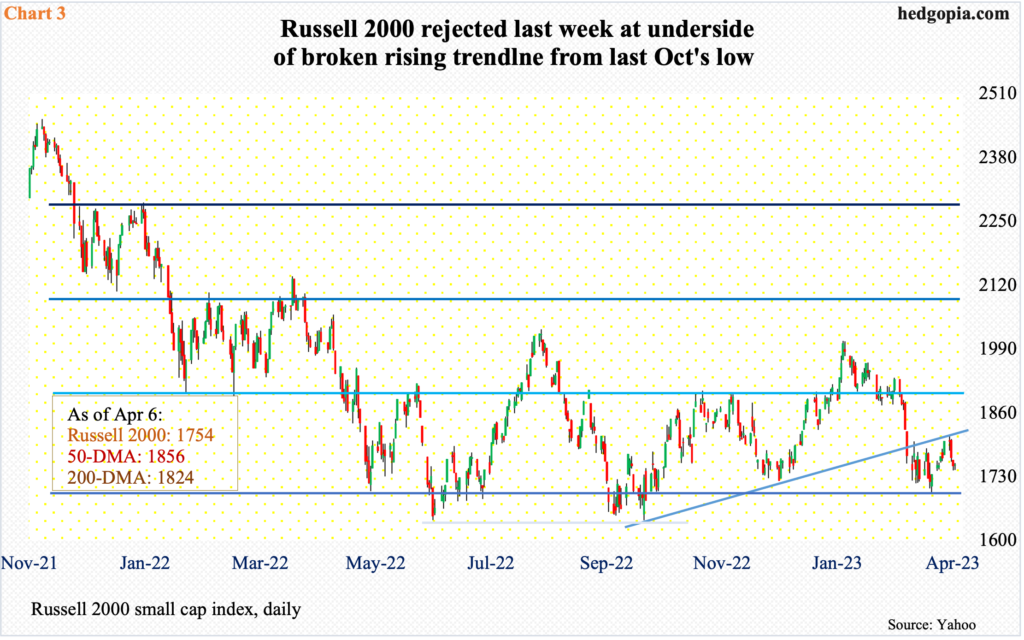
The same trendline that afflicted the S&P 500 also attracted small-cap bears on the Russell 2000. In the prior week, the small cap index closed at 1802 – essentially right in between a 14-month range between 1700 and 1900.
Last Monday, the Russell 2000 tried to rally, tagging 1812 intraday, and that was it. The broken rising trendline from last October was used as an opportunity to sell/go short. By the end of the week, the index closed at 1754 – well under both the 50- and 200-day (Chart 3).
Horizontal support at 1700 goes back to August 2018. Only two weeks ago, this was defended. Odds favor another test in the days and weeks ahead.
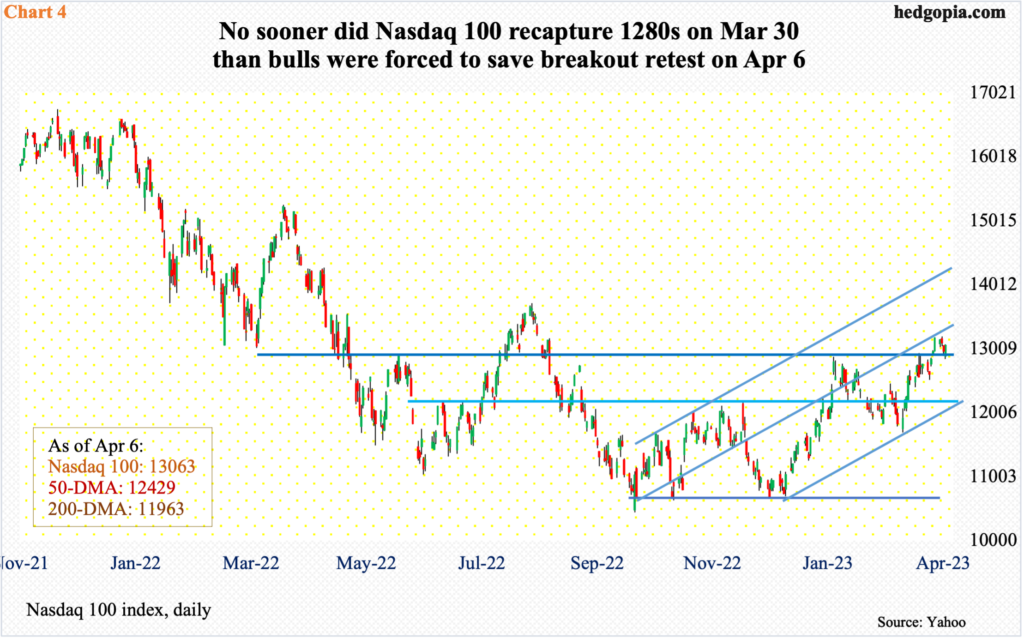
Similar dynamics were in play in the Nasdaq 100.
The tech-heavy index broke out of 12800s on March 30, subsequently rallying to 13204 last Tuesday, which kissed the top end of a rising channel (Chart 4) and sellers showed up, closing out the week at 13063. As a matter of fact, a breakout retest of 12800s already took place on Friday – successfully thus far. For the week, it dropped 0.9 percent, forming a weekly long-legged doji.
Last week’s small drop preceded a three-week rally in which the Nasdaq 100 jumped 11.4 percent. The daily is extended, but for weakness to take hold, tech bears need to reclaim 12800s, which has been an area of interest for both bulls and bears going back to December 2020.
Should weakness develop, there is horizontal support at 12100s, which lines up with the lower end of the channel in question.
Thanks for reading!
