
Following futures positions of non-commercials are as of April 11, 2023.
10-year note: Currently net short 639k, up 18k.
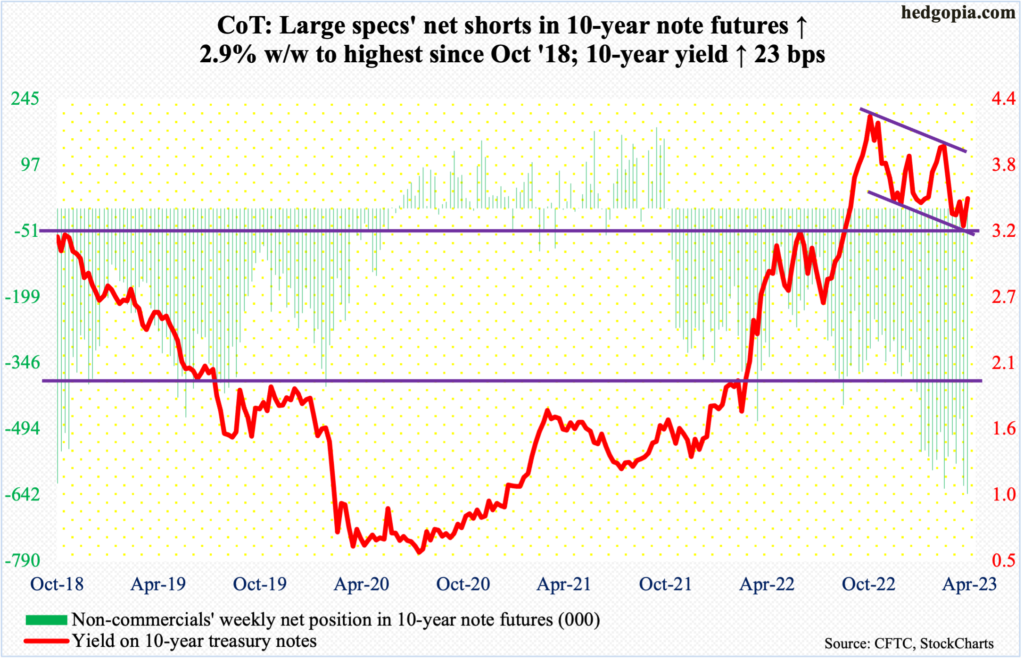
The 10-year treasury yield (3.52 percent) dropped from 4.33 percent last October to the low six sessions ago of 3.25 percent. The rally since has the rates reclaiming the 200-day moving average (3.51 percent) last Friday – albeit only by a tad.
The April 8th low was made on dual support – horizontal going back two decades and descending channel from last October’s high. Arguably, the channel could also be a bullish flag in which case rates eventually break out, but flags ordinarily are short-term in nature, extending a few weeks not months.
In any case, non-commercials are behaving as if a low has been put in and that the rally has staying power. In the last two weeks, their net shorts in 10-year note futures have gone up by 35.5 percent to 639,037 contracts, which are the highest since October 2018.
If shorts (on notes) had their way, they would like to at least rally the yields to the upper trend line around four percent. Before that, the 50-day lies at 3.65 percent and there is gap-down resistance at low- to-high 3.80s.
Even if this were to occur, the fact remains that these traders are now massively net short, which needs to be closed sooner or later. When that happens, this unleashes upward pressure on the notes and downward on the yields. In this scenario, 3.20s is a must-hold for bond bears.
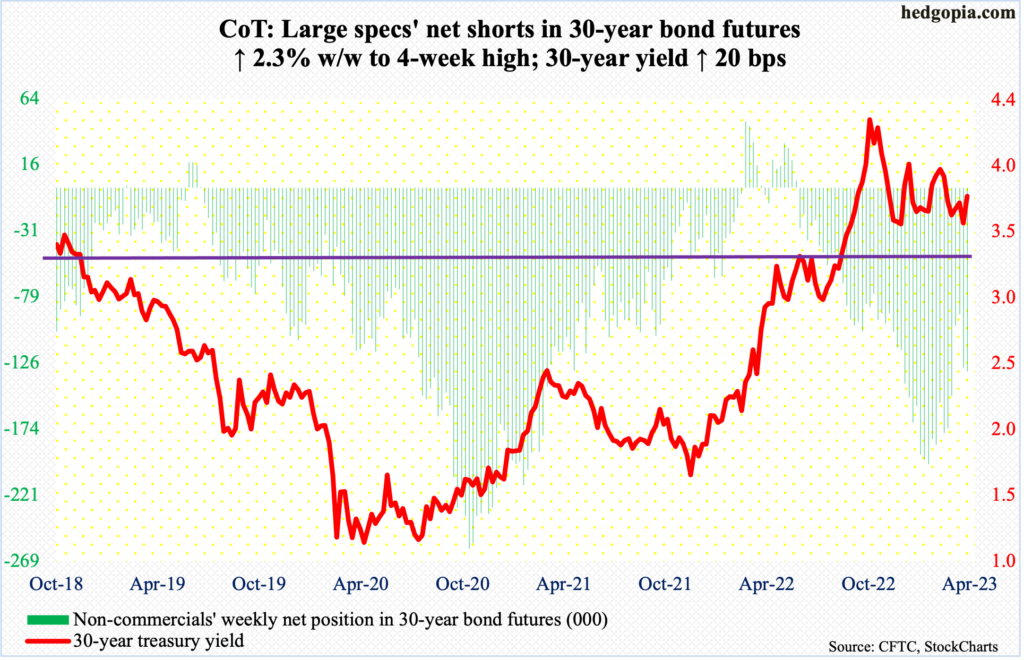
30-year bond: Currently net short 132.6k, up 2.9k.
Major economic releases for next week are as follows.
On Monday, the NAHB housing market index (April) and Treasury International Capital data (February) are on dock.
Homebuilder optimism in March rose a couple of points month-over-month to 44. Last December’s 31 was the lowest since April 2020.
In the 12 months to January, foreigners, on a net basis, sold $203.7 billion in US stocks. The trend, however, is improving as last August they sold a record $293.5 billion worth.
Housing starts (March) are due out on Tuesday. Starts increased 9.8 percent m/m in February to a seasonally adjusted annual rate of 1.45 million units. January’s 1.32 million was the lowest since June 2020.
Thursday brings existing home sales (March). February sales jumped 14.3% m/m to 4.58 million units. This was the first monthly rise after 12 consecutive months of decline.
WTI crude oil: Currently net long 271.5k, up 5.3k.
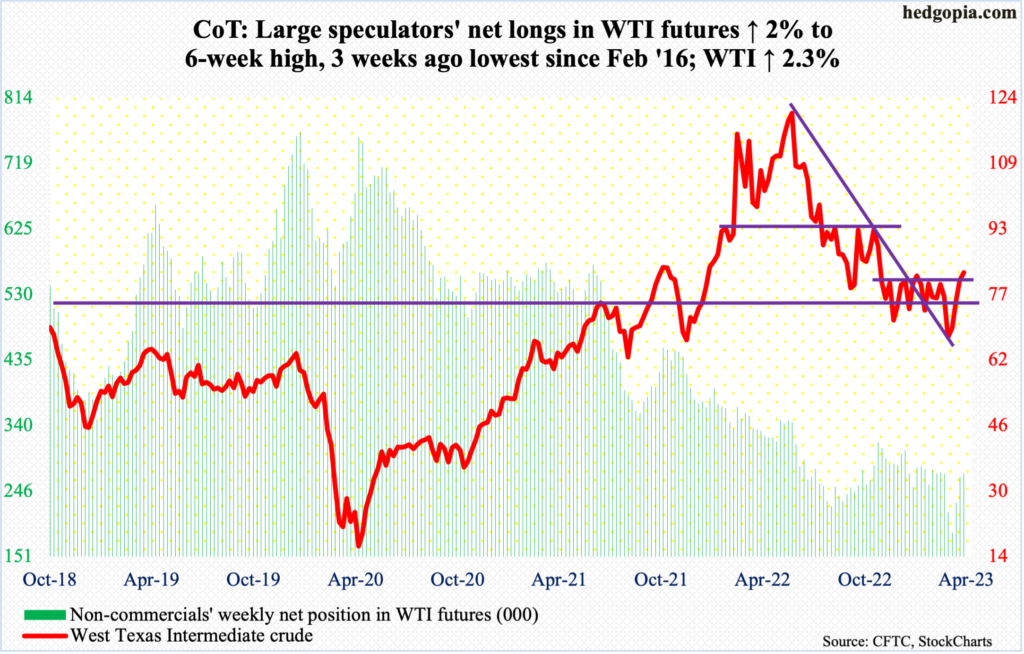
With the month halfway through, WTI ($82.52/barrel) is up 9.1 percent. If this holds, April would be the first up month in six and second in 11. The crude peaked at $130.50 in March last year, made a lower high of $123.68 in June and bottomed last month at $64.36. It has now rallied for four weeks in a row, up 2.3 percent this week.
Last week, on the back of the announcement by eight OPEC+ producers, including Saudi Arabia, Kuwait, and the United Arab Emirates, to cut crude production by a combined 1.16 million barrels per day until the end of the year, WTI rallied 6.7 percent to close right at the upper end of a four-month range between $71-$72 and $81-$82. This week, it poked its head out of that.
The 200-day at $83.52 is right above, and the daily is way overbought. In the sessions ahead, odds favor a sideways move at best and a giveback of some of the recent gains at worst.
In the meantime, as per the EIA, US crude production in the week to April 7 increased 100,000 barrels per day week-over-week to 12.3 million b/d. Crude imports dropped 951,000 b/d to 6.2 mb/d. Stocks of gasoline and distillates fell as well – by 330,000 barrels and 606,000 barrels to respectively 222.2 million barrels and 112.4 million barrels. Crude inventory, however, grew 597,000 barrels to 470.5 million barrels. Refinery utilization decreased three-tenths of a percentage point to 89.3 percent.
E-mini S&P 500: Currently net short 307.6k, down 13.8k.
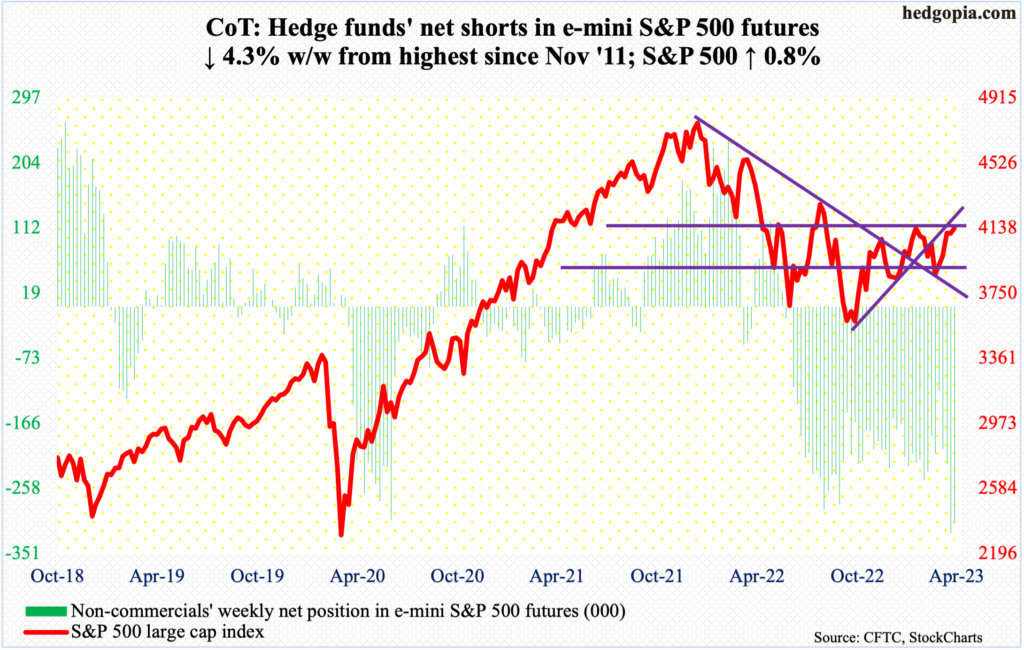
Non-commercials only slightly cut back their net shorts from the prior week’s highest since November 2011. They are staying with their bearish bias and are likely to cover only if the index bolts out of what is now a confluence of three resistance levels. There is horizontal at 4100 – or just north of it. This coincides with the underside of a broken rising trendline from last October’s low when the S&P 500 (4138) bottomed at 3492 (more on this here). Plus, the 20-month moving average lies at 4174.
Intraday Friday, the large cap index rallied as high as 4163, only to close the session lower 0.2 percent to 4138 with a long-legged doji right on the 10-day, which has attracted bids the last several sessions. For now, this is the one to watch. The average is still rising and needs to roll over for shorts to get traction. On the monthly, several indicators have approached the median from below. If it is still a bear market, they likely will roll over right here.
The daily remains grossly overbought.
Euro: Currently net long 163.3k, up 19.9k.
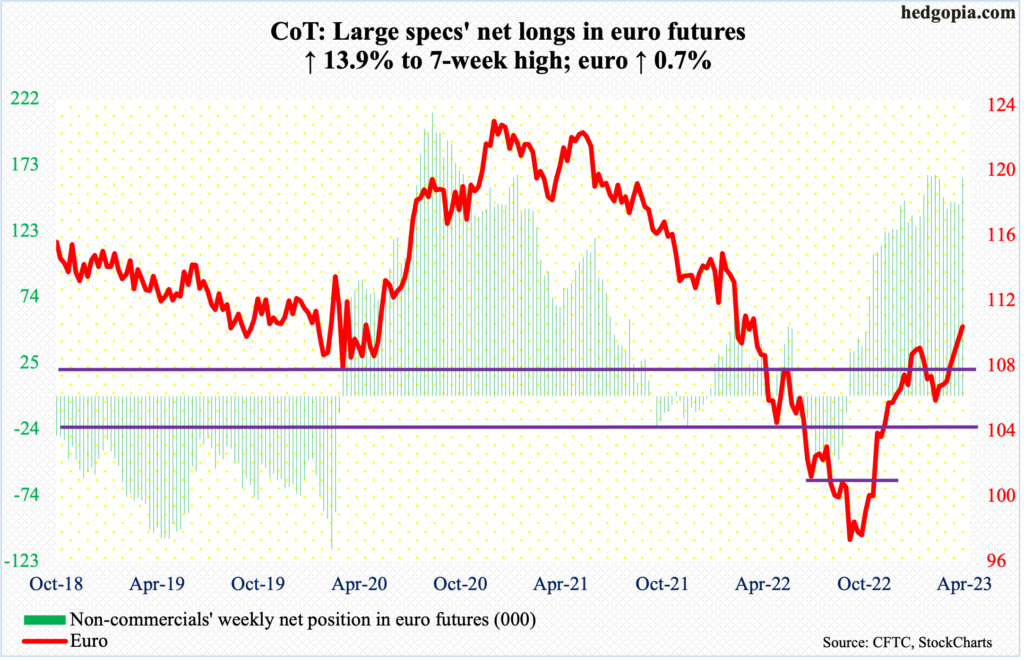
Euro bulls were this close to breaking out of $1.09-$1.10, but not quite. Intraday Thursday, the currency ticked $1.1069 and $1.1074 on Friday, but closed the week out at $1.10. So, it remains a wait and watch.
Just by the look of things, the daily looks tired.
In the event of downside pressure, bulls can still step up and defend the 50-day ($1.0746), or, in a worse-case scenario, regroup near $1.04-$1.05, which has been an important level going back at least eight years and which was reclaimed last December.
Gold: Currently net long 192.7k, down 2.5k.
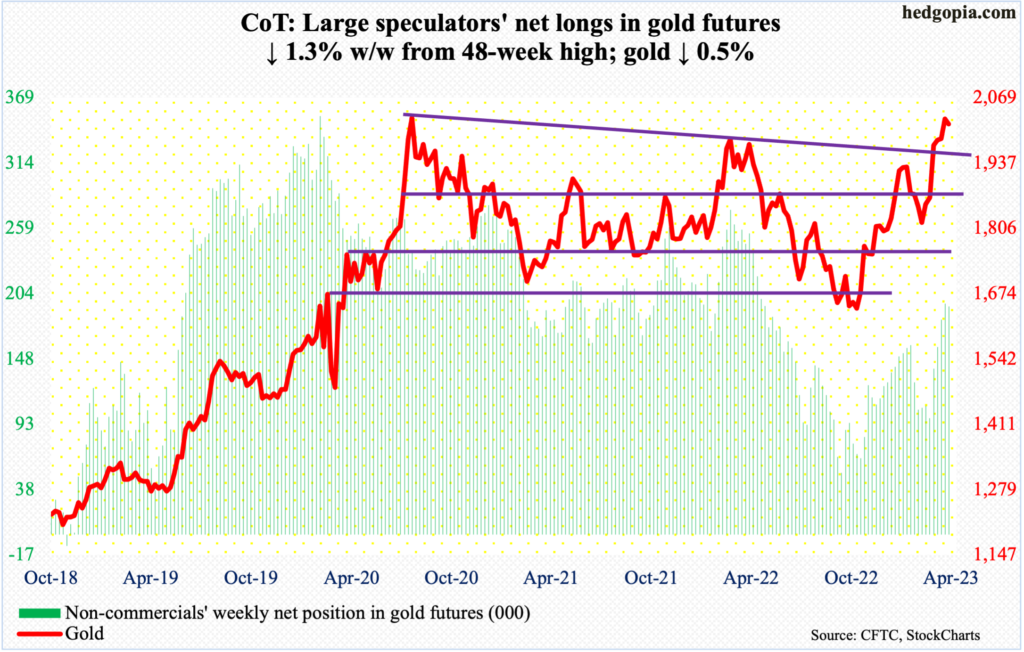
Gold touched $2,063 on Thursday, which was the highest print since tagging $2,079 in March last year. Before that in August 2020, the metal ticked $2,089, which is an all-time high. Both those highs were followed by quick reversals, leaving behind candles with long upper wicks. It is too soon to say this is what might await the gold bugs but, with gold closing at $2,016/ounce at the end of the week, the monthly candle has indeed a little bit of a wick to it.
But April is only halfway done, so there is time for gold bulls to repair the damage. Friday’s 1.9-percent drop might prove costly, time will tell.
For now, the yellow metal wants to go lower. The first test of bulls’ mettle is going to be $2,000, which it broke out of early this month after having gone sideways for most of the second half last month. After that is $1,970s.
Nasdaq 100 index (mini): Currently net short 2.1k, down 16.3k.
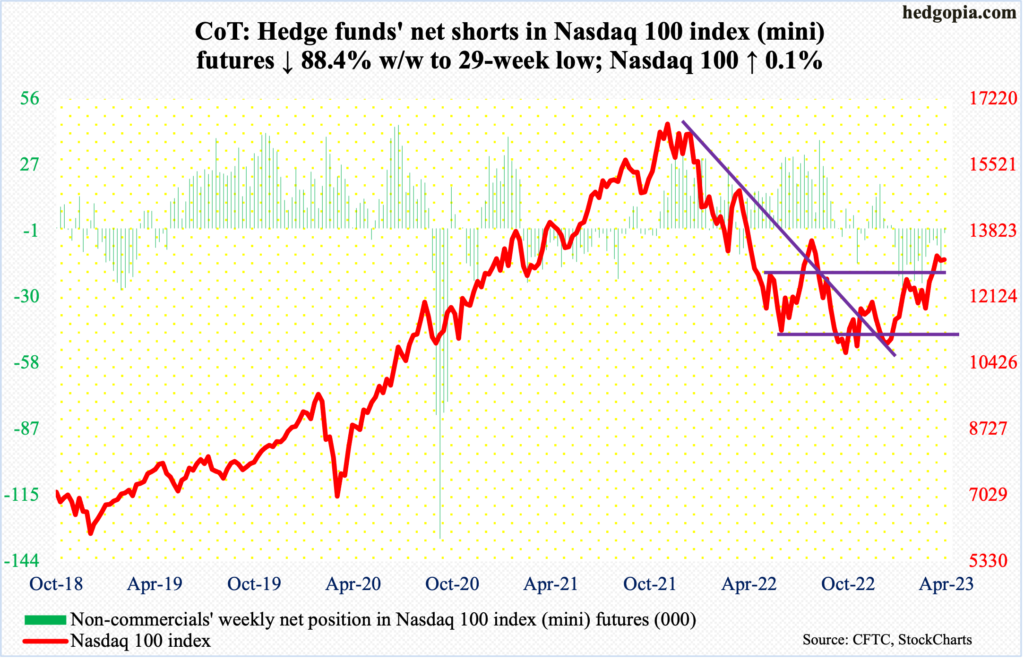
The Nasdaq 100 eked out a gain of 0.1 percent this week. This followed a breakout two weeks ago at 12800s.
From bulls’ perspective, the good news is that the breakout was vigorously defended this week, the bad is that they are having to fight tooth and nail to stay above the 10-day (13051). The tech-heavy index closed out the week at 13080.
The way the daily is shaping up, odds favor a test of 12800s in the sessions ahead.
Russell 2000 mini-index: Currently net short 45.1k, down 11.8k.
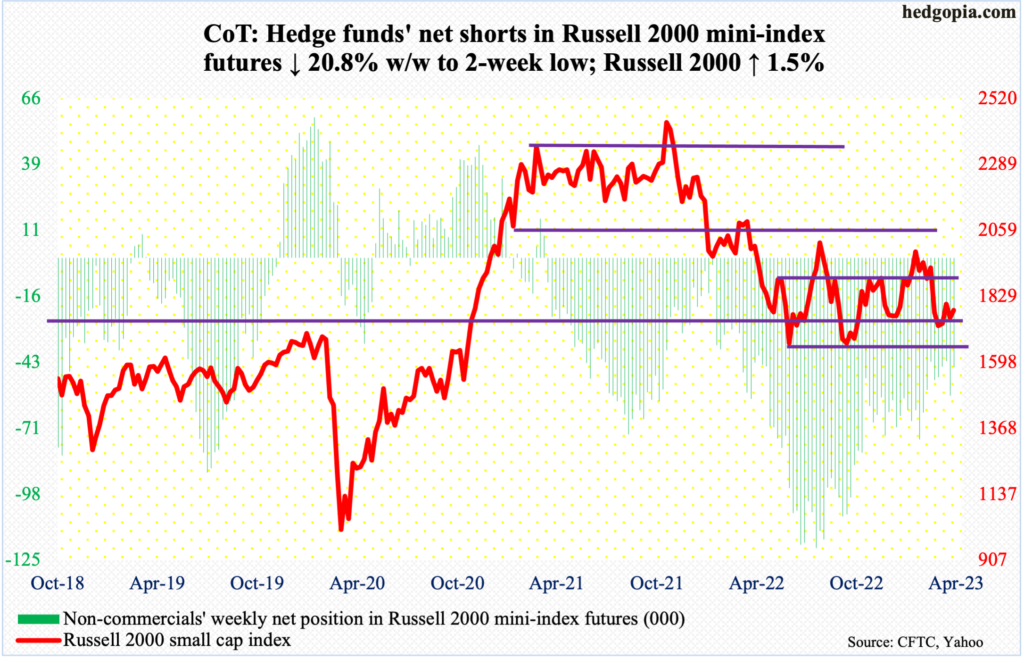
Last week, the Russell 2000 tagged 1812 intraday Monday to test the underside of the broken rising trendline from last October and failed. This week, it gave that trendline another try on Friday with a lower high of 1805 and met the same fate, attracting droves of offers, ending the session at 1781.
Failure to recapture the trendline as well as the mid-point of the 1700-1900 range it has been in since January last year opens the door toward a test – again – of crucial 1700, which was successfully tested three weeks ago.
US Dollar Index: Currently net long 13.3k, down 842.
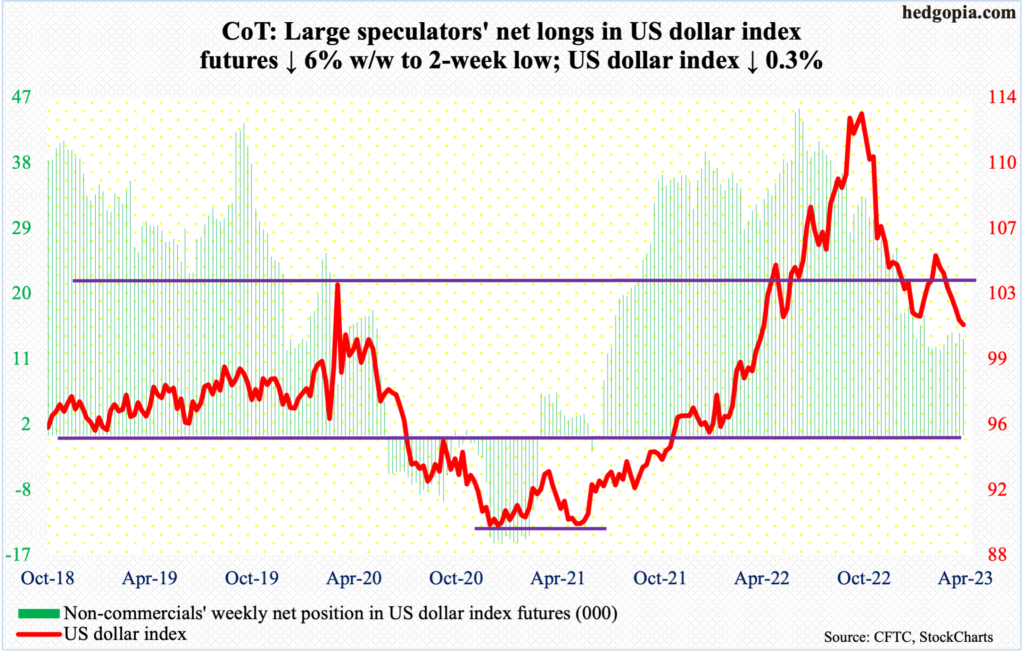
Dollar bulls have an opportunity to put their foot down and defend an eight-year horizontal support at 100-101. Friday’s intraday drop to 100.42 was bought, ending the session at 101.25. On February 2, the US dollar index made an intraday low of 100.68 before reversing and rallying to 105.87 by March 8.
A decent rally can ensue in the right circumstances, as the daily is oversold. This is near term. Mid-to long-term, however, 100-101 likely gives away, the same way 103-104 has been lost. The index peaked last September at 114.75, having rallied from 89.17 from January 2021.
VIX: Currently net short 49.4k, down 7.7k.
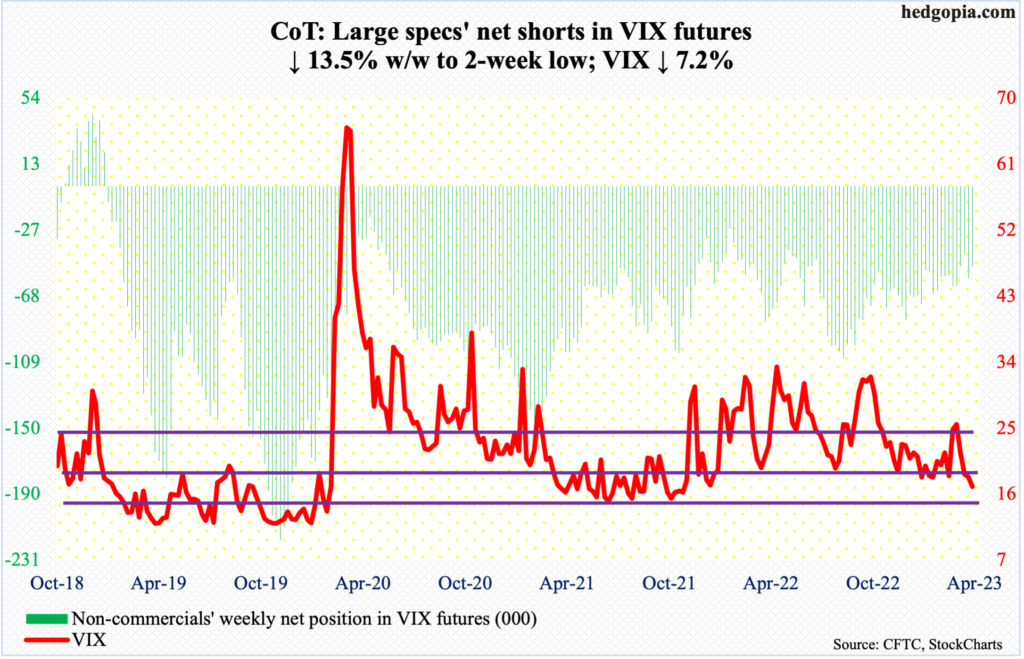
VIX’s 7.2-percent drop this week was the fourth weekly decline in a row. Five weeks ago – on March 13, to be precise – the volatility index experienced a spike reversal at 30.81.
This week, VIX closed at 17.07 – essentially on a rising trendline from November 2017 when it printed an all-time low of 8.56. A break to the downside will be a major victory for equity bulls, opening the door toward 14-15.
With that said, the daily remains in oversold territory.
Thanks for reading!
