
There is no shortage of divergences – be it in macro or other assets, including equities. Major equity indices peaked early this month but put foot down early last week. Medium term, building on it further can prove difficult. Overbought weekly conditions have begun unwinding.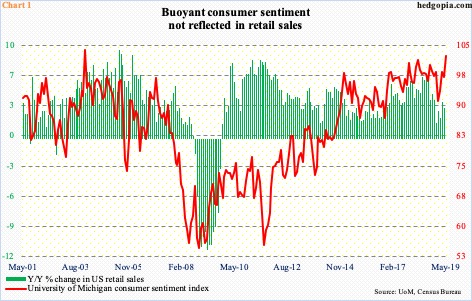
From macro to equities, divergences abound.
US retail sales are not keeping up with consumer sentiment. Consumers are saying one thing and doing the other. The University of Michigan’s consumer sentiment index jumped 5.2 points month-over-month in May to 102.4 – the highest since January 2004. Since January’s (this year) low of 91.2, it has gone up 11.2 points. Retail sales are not as buoyant.
In the 12 months to April, sales rose 3.1 percent to a seasonally adjusted annual rate of $513.4 billion but fell 0.2 percent from March’s record $514.3 billion. Year-over-year growth has decelerated from last July’s 6.6-percent pace, although it has risen from last December’s 1.2 percent (Chart 1).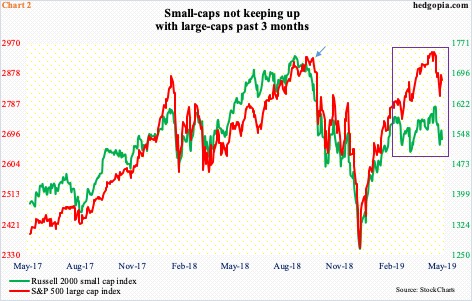
In the equity land, small-caps have been left behind by large-caps. Off the lows of last December, they both rallied strongly. Come late February, small-caps hit the wall, even as large-caps marched on.
On the Russell 2000 small cap index (1535.76), several times going back to January last year, bulls and bears locked horns just north of 1600. On February 25, the index retreated from 1602.10. Later, on April 29, it again backed away from 1603.08. On the 6th this month, it managed to close at 1614.98, but only to then come under pressure. By Monday last week, it dropped 6.1 percent intraday.
Off the December lows, the Russell 2000 never managed to rally to a new high. The S&P 500 large cap index (2859.53) did. Even as the former began a sideways journey beginning late February, the latter rallied to 2954.13 on May 1, before losing 5.2 percent intraday by Monday last week. Ten sessions ago, small-cap bulls were denied at 1600; five sessions later – that is Monday last week – large-cap bulls defended breakout retest at 2800.
Taking a pulse of investor sentiment through whether they show preference for small-caps or large-caps, the current mood is risk-off. It has been that way for a while.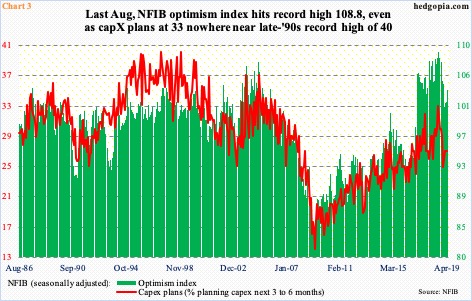
The divergence shown in Chart 3 is of a slightly different variety but is no less important.
The NFIB optimism index, measuring small-business sentiment, rose 1.7 points m/m in April to 103.5. It has been north of 100 for 29 straight months – a first in its 33-plus-year history. We are talking uncharted territory, including last August’s record 108.8.
These businesses’ capex plans tell a different story. In the late ’90s – ’96-’98 – 40 was hit four times. This level has not been surpassed since. Post-Great Recession, the closest it came was last August when it hit 33. For three months through April, it has been stuck at 27. In other words, small businesses are not gung-ho about capex.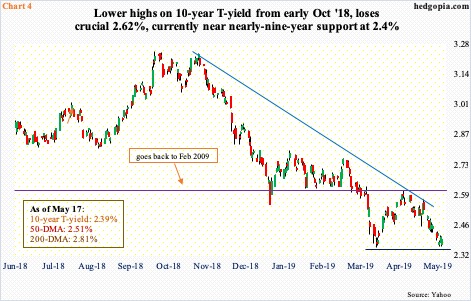
There is a similar dichotomy between how equities view things and how bonds do. Even after the selloff this month, most major equity indices are not that far away from their respective all-time highs. Sovereign bonds are nowhere near as sanguine.
The 10-year Treasury yield (2.39 percent) peaked last October at 3.25 percent. In fact, that is exactly when equities began to fall apart (arrow in Chart 2). Then, after bottoming late December, the S&P 500 went on to surpass its October high, albeit not by much. The 10-year, on the other hand, persistently made lower highs. It bottomed at 2.36 percent in March. The rally since that low stopped at 2.62 percent, a crucial level going back a decade (Chart 4). The March low was tested last Wednesday – successfully. At around 2.4 percent lies nine-year support. Bond vigilantes are not channeling the hunky-dory attitude projected by equity investors.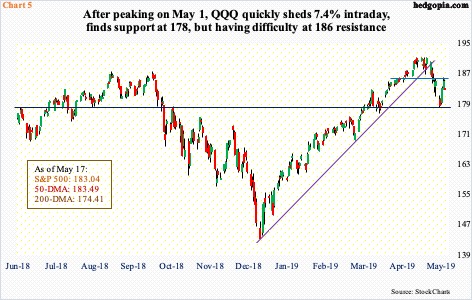
Until the most recent selloff, tech carried a lot of momentum. So far this month, the Nasdaq 100 index suffered two back-to-back down weeks. Before this, it rallied in 18 out of 19. The drop since May 1 stopped last Monday. On QQQ (Invesco QQQ Trust), bulls showed up at $178, where support goes back to last June. At the same time, both Thursday and Friday last week, sellers were quick to pull the trigger at $186, or thereabouts (Chart 5). The ETF ($183.04) closed out the week right underneath the 50-day moving average. If weekly indicators prevail, there is a long way to go on the downside.
Interestingly, within tech, semis – which can be treated as modern-day copper – act a lot weaker (not shown here). SMH (VanEck Vectors semiconductor ETF) has fallen in three out of last four weeks, losing support at $109-plus. Last week, bulls tried to test the underside of that broken support and were rejected vehemently; when it was all said and done, SMH ($105.43) fell 4.6 percent. There is decent support at $95-96.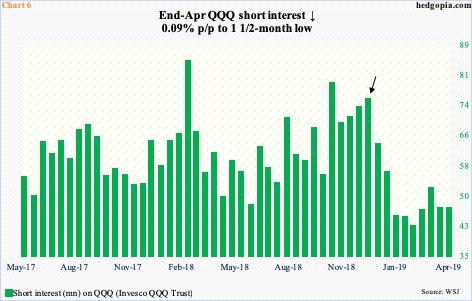
At least on QQQ, bulls are not going to get much help from short interest. At the end of April, it fell 0.1 percent period-over-period to 47 million shares. This is a one-and-a-half-month low. Mid-December, short interest was 75 million (arrow in Chart 6). As the ETF bottomed late that month, shorts covered/got squeezed, providing a tailwind to the rally. This factor is missing currently. End-February, short interest was down to a 23-month low.
Off the December lows, QQQ put up quite a show, up over 33 percent before coming under pressure early this month. As mentioned earlier, weekly overbought momentum indicators have just begun unwinding. This is a medium-term risk. Near term, bulls having defended $178 last week, it could go either way, with a likely downward bias. As was the case last week, a weekly iron condor likely offers good risk/reward odds.
QQQ May 24th iron condor:
- Short 186 call at $0.75
- Long 188 call at $0.27
- Short 176 put at $0.40
- Long 174 put at $0.24
The hypothetical trade earns $0.64 in premium, with $1.36 at risk. Breakeven points are $186.64 and $175.36. The trade assumes higher downside than upside risks this week. For the maximum loss to occur, the underlying will need to drop 5.2 percent or rally 2.7 percent. Premium is kept if QQQ remains within the short strikes.
Thanks for reading!
