
As talk around inflation has gone up several notches, the 10-year treasury yield sits on triple support. A breach has room to squeeze TLT shorts.
Inflation is front and center. It is perky.
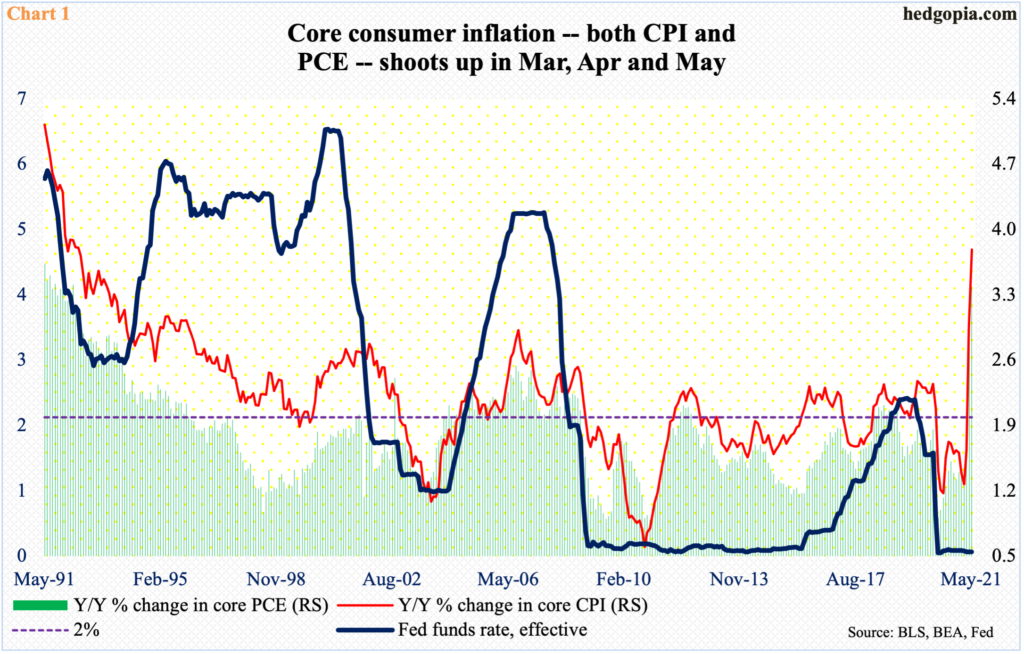
As recently as February this year, core consumer inflation – measured by both the consumer price index and the personal consumption expenditures – lied in suppressed territory, up 1.3 percent and 1.4 percent year-over-year respectively. Then it awoke from its slumber. By May, they were rising at a 3.8 percent and 3.4 percent clip, which was the fastest pace of price appreciation since June and April 1992, in that order (Chart 1).
This is coming at a time when the US economy itself has come roaring back from its post-pandemic tumble.
Later this morning, the ISM manufacturing index for June will be published. Manufacturing activity rose 0.5 points month-over-month in June to 61.2. The index has remained above 60 for four months in a row – and in five of the last six months. Similarly, services activity in May was up 1.3 points m/m to 64, for a third straight reading of north of 60.
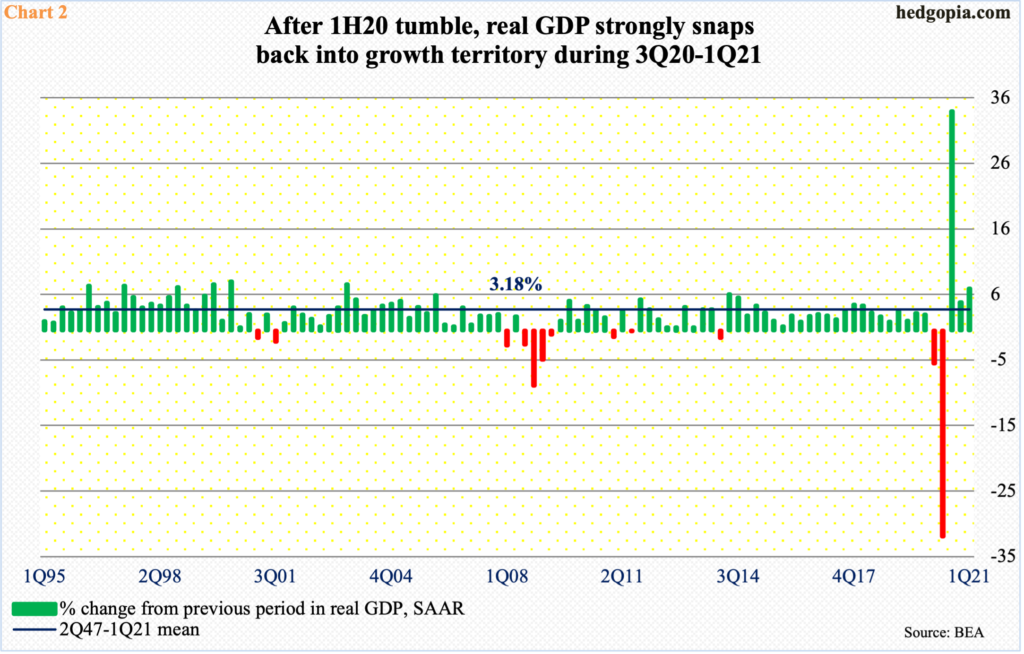
This is in line with how GDP has fared. Real GDP in 1Q21 jumped at an annualized rate of 6.4 percent (Chart 2). This followed an increase of 4.3 percent in 4Q20 and 33.4 percent in 3Q20. Prior to that, the economy tumbled 31.4 percent in 2Q20 and five percent in the quarter before that.
At $19.1 trillion in 1Q21, real GDP is a stone’s throw away from reaching, and eclipsing, the pre-pandemic high of $19.3 trillion from 4Q19. A new high probably takes place in the June quarter. The Atlanta Fed’s GDPNow model currently forecasts an 8.3-percent jump in real GDP in 2Q21.
Yet, the 10-year treasury yield cannot rally.
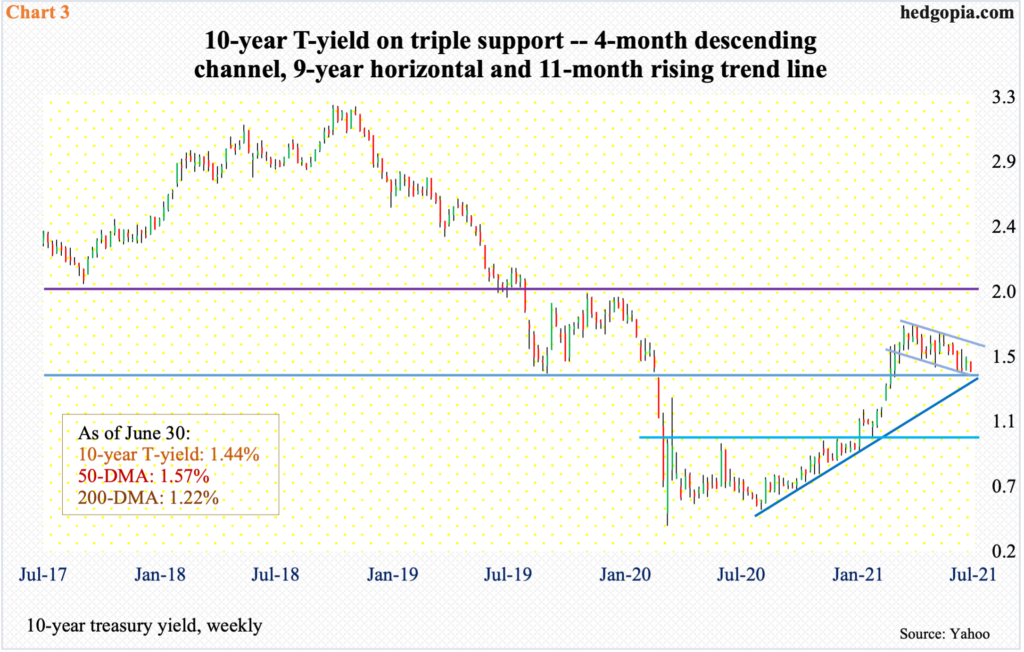
Rates began the year on a strong note, breaking out of one percent as soon as January began and then rallying as high as 1.77 percent on March 30, before heading lower.
The 10-year (1.44 percent) currently finds itself on triple support – the lower bound of the channel mentioned above, a rising trend line from last August and a nine-year-old horizontal support at 1.40s (Chart 3).
As things stand, a breach of this support is looking more and more likely in the weeks ahead.
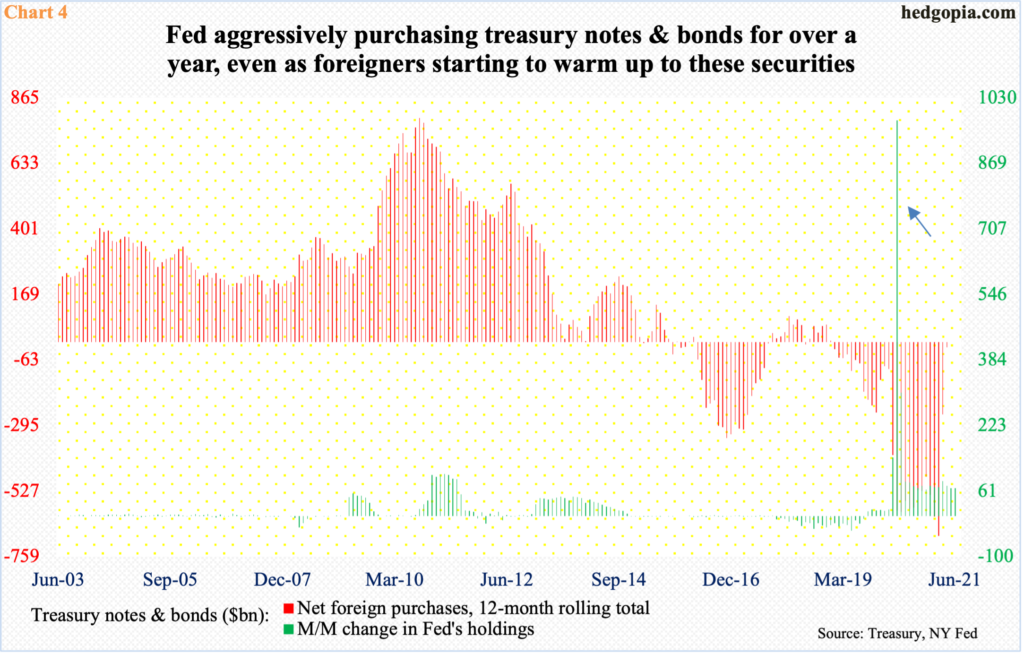
The Federal Reserve continues to support the long end of the treasury yield curve. Every month, it spends up to $80 billion in purchases of notes and bonds (and another $40 billion goes toward mortgage-backed securities). Its balance sheet has reached $8.1 trillion, up from $4.2 trillion in early March last year. Back then, in order to deal with the dislocations caused by Covid-19, the Fed was accumulating these securities hand over first. In April alone (last year), it purchased $975 billion worth (arrow in Chart 4). Now, the pace has moderated, but it routinely spends $70 billion to $80 billion every month. (In the chart, June’s bar is incomplete, as data for the week to Wednesday will be published today.)
The budget deficit has gone through the roof, with the government running $3.3 trillion in red ink in the 12 months to May. Over the same time period, issuance of treasury notes and bonds amounted to $2.4 trillion. Despite its aggressive purchases, the Fed cannot absorb all the issuance. Bids will also have to come from private parties. So, obviously the likes of pension funds and insurance companies are buying these securities at these yields.
Importantly, foreigners of late have been warming up. They have done quite a U-turn. As early as this February, on a 12-month basis, they were net sellers of $685.1 billion in treasury notes and bonds. In the next couple of months – that is, by April – the selling tapered to $18.2 billion.
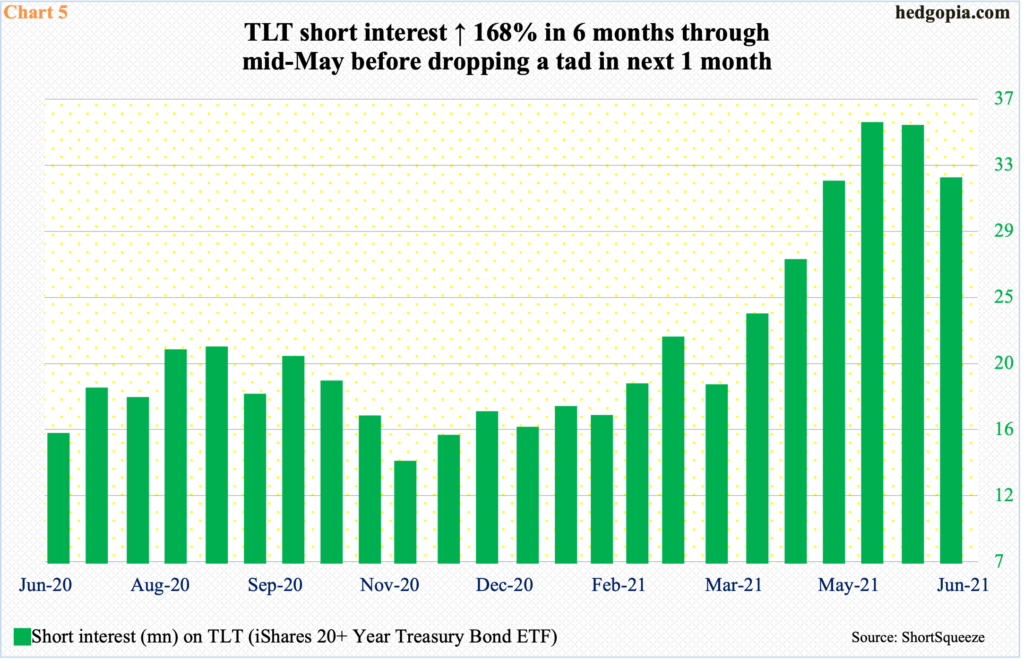
If the 10-year continues to attract bids, this will have come at a time when short interest on TLT (iShares 20+ Year Treasury Bond ETF) remains elevated. In fact, mid-May, it reached 35.3 million shares, up 168 percent from mid-November last year. Mid-June was down to 31.7 million, but short interest remains high.
Shorts are obviously betting on a selloff in these securities. There is an inverse relationship between price and yield. Hence the significance of where the 10-year currently finds itself in. A breach of this triple support likely results in short squeeze – magnitude and duration notwithstanding.
Thanks for reading!
