
There were new highs all around last week. But after having rallied huge in the past month, major equity indices are not sending one uniform message. A reprieve is due, even as volatility is getting ready to perk up – again.
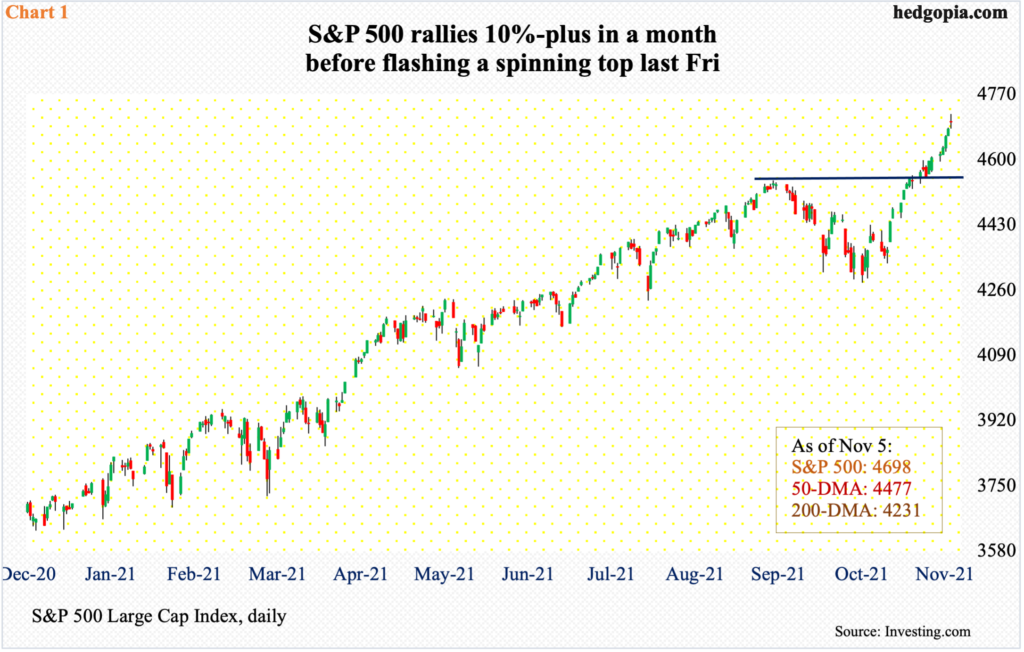
The S&P 500 bottomed at 4279 on October 4. Last Friday, it tagged 4719. The 10.2-percent jump has a vertical look to it, with the large cap index rallying for five straight weeks and in 16 out of the last 18 sessions.
It increasingly feels like longs are already positioning themselves for the seasonality factor that tends to favor them. Fund flows are cooperating. In the futures market, non-commercials have accumulated net longs that are the highest since January 2019 (more on this here).
This has also pushed the index into gross extended territory. The daily RSI crossed 76 last Friday. In that session, the S&P 500 rallied 0.4 percent but was up as much as 0.8 percent; bulls’ inability to hang onto all of the gains resulted in a spinning top candle (Chart 1).
Fatigue could be setting in. In August and September, the index faced resistance at 4540s but pushed through the roadblock in October. As things stand, a breakout retest is the path of least resistance.
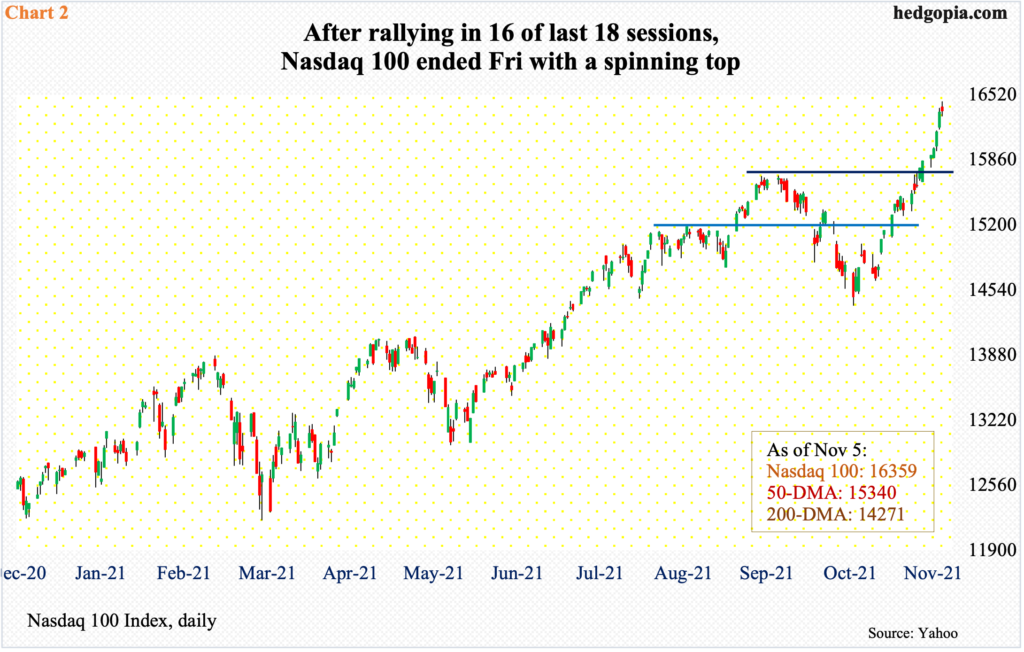
Over on the Nasdaq 100, from the October 4 low through last Friday’s fresh high 16454, it shot up 14.4 percent. As is the case with the S&P 500, the Nasdaq 100 has rallied in the last five weeks and in 16 out of the last 18 sessions. This is not sustainable – seasonality or not.
That said, tech bulls should be commended for their resilience. September produced a bearish outside month, which was negated right away by November’s bullish outside month. At Friday’s close of 16359, the Nasdaq 100 is four percent from 15700s, which it broke out of seven sessions ago (Chart 2). This is the nearest support. After this lies straight-line support at 15100s.
Incidentally, last Monday’s low of 15785 came close to testing the 15700s breakout. Another test should be round the corner. Last Friday, with the daily RSI closing north of 78, a spinning top appeared on the daily.
From the perspective of being overbought, small-caps are no exception either. But at the same time they witnessed a major breakout last week.
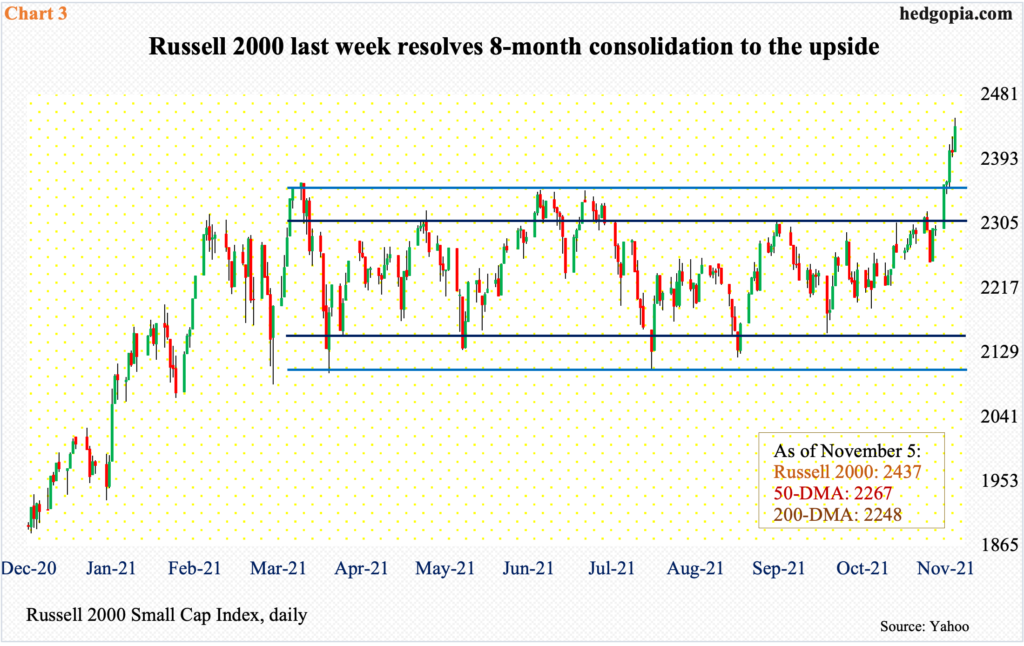
For nearly eight months now, the Russell 2000 has been rangebound between 2350s and 2080s, and between 2280s and 2150s within this box. Last week, the index started out strong with Monday’s 2.7–percent rally, landing it right on the top of the range. This was then followed by Wednesday’s 1.8-percent rise resulting in a clear breakout (Chart 3).
Leading up to this, the Russell 2000 surged 144 percent between March last year and March this year, before going sideways. Now that the congestion has been resolved to the upside, assuming the breakout is genuine, technically-oriented longs would be hoping to reach 2600 eventually. The Russell 2000 closed last week at 2437.
Small-caps tend to have larger exposure to the domestic economy than their large-cap brethren, which also have international exposure. Many view last week’s breakout as potentially good news to come as far as the US economy is concerned.
As last Friday’s jobs report showed, October produced 531,000 non-farm jobs, which was much better than the consensus 450,000. As well, both August and September were revised higher. With 10 months in, the economy has added an average 582,000 jobs every month this year.
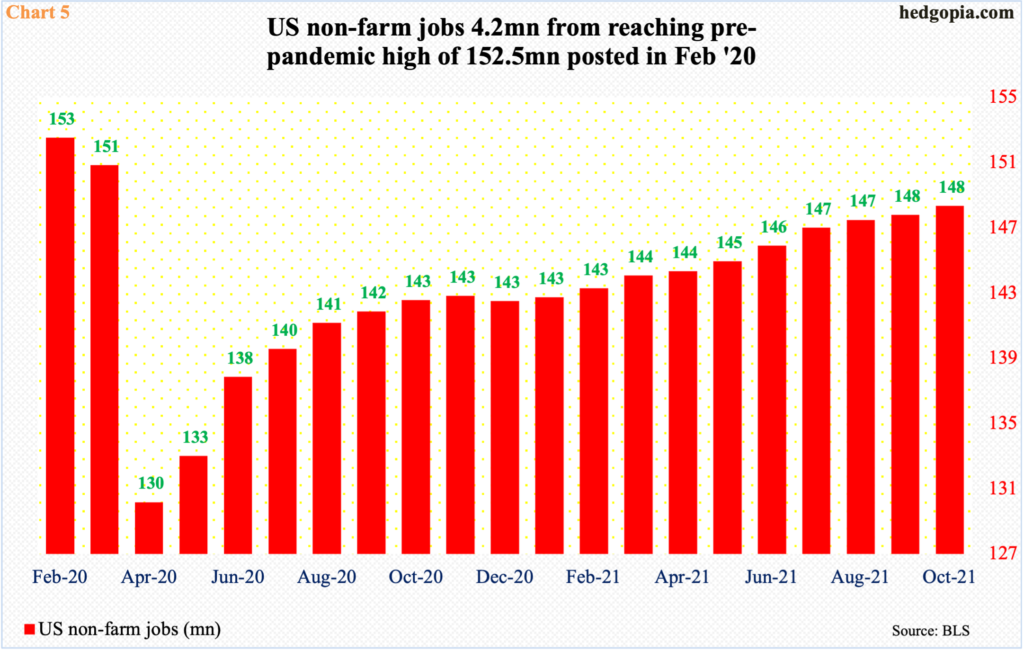
At the pre-pandemic peak in February last year, there were 152.5 million non-farm jobs (Chart 4). This then collapsed to 130.2 million in April. The recovery since that low has added 18.2 million jobs. At October’s 148.3 million, the economy needs to produce another 4.2 million before reaching the pre-pandemic high. In the meantime, the unemployment rate dropped to 4.6 percent in October, down from the record high 14.8 percent in April last year; in February last year, unemployment was 3.5 percent.
The bottom line: the job market is healing. Small-caps’ performance last week suggests the momentum will continue. Although the long end of the treasury yield curve is beginning to not quite agree.
At last week’s FOMC meeting, the Fed announced it would begin to reduce its monthly bond purchases by $15 billion. Currently, it buys up to $120 billion in treasury notes and bonds ($80 billion) and mortgage-backed securities ($40 billion). The balance sheet more than doubled from $4.24 trillion in early March last year to $8.57 trillion. At the end of the tapering by the middle of next year, the central bank’s assets will have crossed $9 trillion.
Last Wednesday, post-FOMC meeting, the 10-year treasury yield rallied three basis points, but only to then decline 13 basis points in the next couple of sessions. Initially, bond bears reacted to the announcement of tapering. Soon, they probably realized that Chair Jerome Powell at the post-meeting press conference also said the Fed can be patient in raising interest rates, and their enthusiasm fizzled.
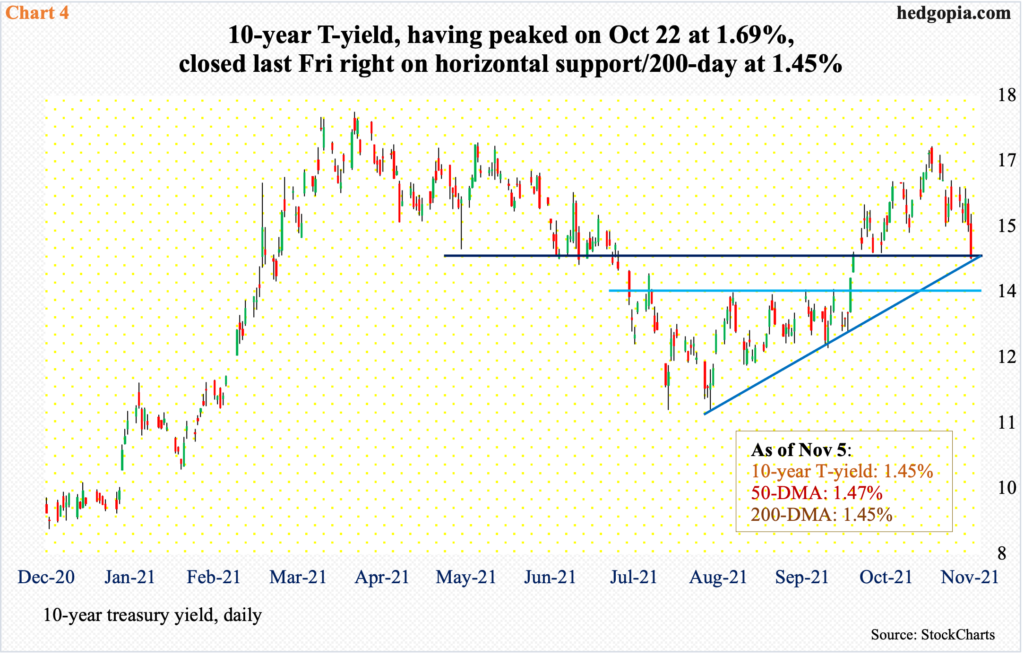
The 10-year has been under pressure since posting a five-month high 1.69 percent on October 22. Last Friday, rates landed right on the 200-day moving average as well as horizontal resistance at mid-1.40s (Chart 5). This is crucial support. A breach opens the door toward a test of 1.39 percent.
Bond vigilantes’ reaction last Friday was particularly interesting considering the much-better-than-expected jobs report for October. It is possible they are looking well into the future and expect a meaningful slowdown in economic activity next year – in response to the Fed’s tapering, to be followed by a probable increase in rates in the second half next year.
In this scenario, equities, too, likely follows the 10-year yield sooner or later. The seasonality trade is in full bloom right now, and even here this in all probability has gotten ahead of itself. As the first three charts show, equities have rallied huge in the past month. As suggested by Friday’s spinning top on both the S&P 500 and the Nasdaq 100, some are beginning to lock in their gains.
Volatility is suppressed and looks to be on the verge of a rally.
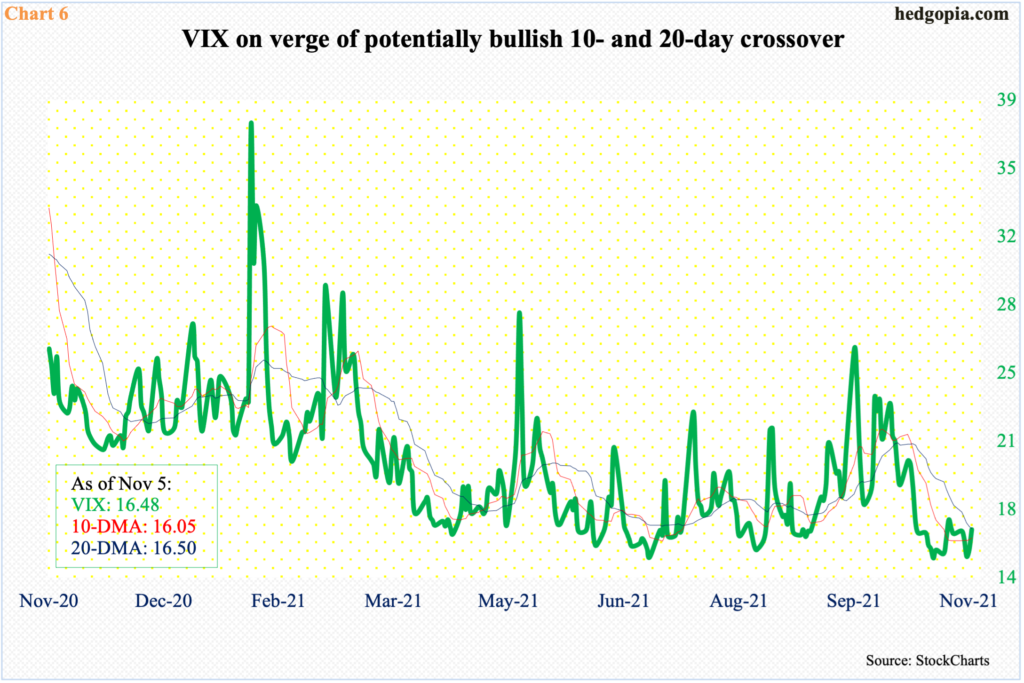
In the last couple of weeks, the VIX index went sub-15 several times. This again occurred on Wednesday through Friday last week. Friday’s intraday drop to 14.95 resulted in an intraday reversal to the upside, ending the session at 16.48. The daily MACD last week witnessed a potentially bullish crossover. To boot, a potentially bullish crossover between the 10- and 20-day is close to forming (Chart 6). Nearest resistance lies at 18, and after that low-20s.
Thanks for reading!
