
Following futures positions of non-commercials are as of November 2, 2021.
10-year note: Currently net short 268.7k, up 153.8k.
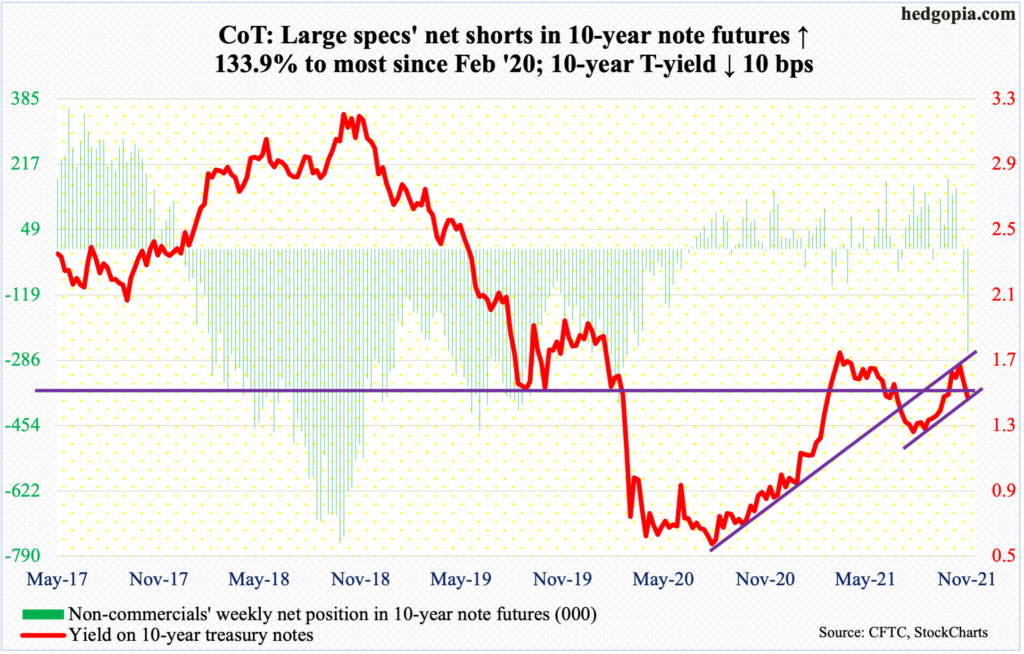
The 10-year treasury yield has been under pressure since posting a five-month high 1.69 percent on October 22. On Wednesday, as a two-day FOMC meeting concluded, rates rallied three basis points to 1.58 percent. As expected, the Fed announced it would begin to reduce its bond purchases by $15 billion a month.
Currently, the Fed buys up to $120 billion in treasury notes and bonds ($80 billion) and mortgage-backed securities ($40 billion). The balance sheet has more than doubled from $4.24 trillion in early March last year to $8.57 trillion. At the end of the tapering by the middle of next year, the central bank’s assets will have crossed $9 trillion.
The news of the start of tapering probably emboldened the bond bears, hence the rise in rates on Wednesday. But then again, Chair Jerome Powell at the post-meeting press conference also said the Fed can be patient in raising interest rates (more on this here). On Thursday and Friday, the 10-year went the other way, down six and seven basis points respectively.
Friday’s reaction was particularly interesting considering the much-better-than-expected jobs report for October, with the economy adding 531,000 non-farm jobs and the unemployment rate dropping to 4.6 percent.
The 10-year (1.45 percent) ended the week right at the 200-day moving average as well as horizontal support at mid-1.40s. Prior to this, as of Tuesday, non-commercials aggressively added to net shorts in 10-year note futures. A breach of the support has the potential to cause short-covering. In fact, it is very possible the drop in rates in the last two sessions was because of shorts turning tail.
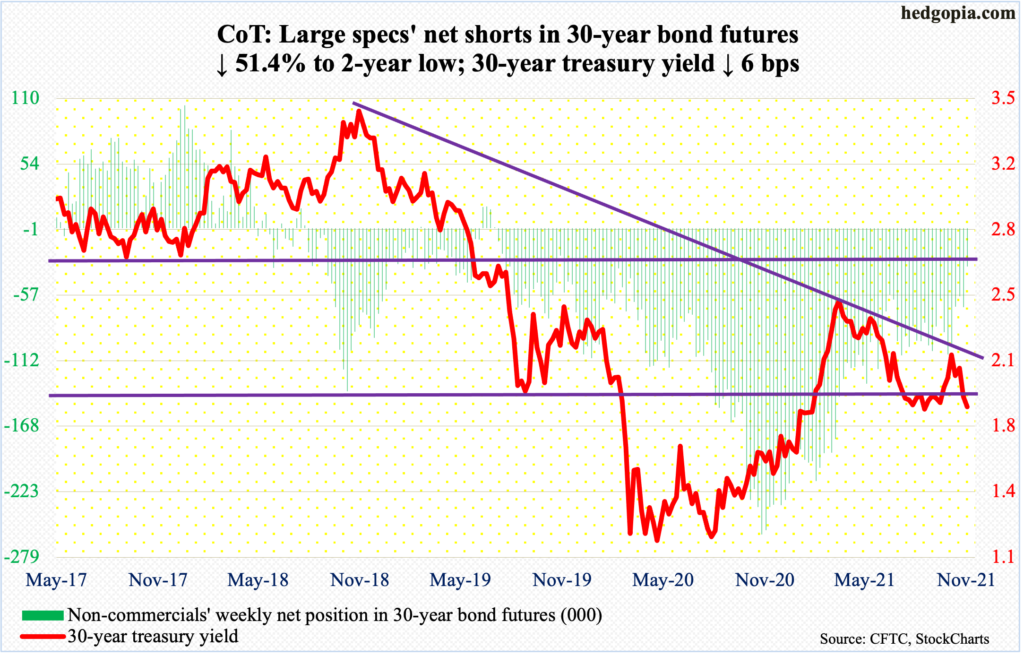
30-year bond: Currently net short 32.5k, down 34.4k.
Major economic releases for next week are as follows.
The NFIB Optimism Index (October) and the producer price index (October) are due out on Tuesday.
In September, small-business job openings rose a point month-over-month to fresh record 51. In May last year, openings languished at 23.
Both headline and core producer prices in September rose 0.4 percent over August. Over a year ago, they respectively gained 0.4 percent and 0.7 percent.
The consumer price index (October) will be out on Wednesday. In the 12 months through September, core consumer prices rose four percent, which is slower than June’s 4.5 percent but substantially higher than the post-pandemic low of 1.2 percent from June last year.
Friday brings job openings (JOLTs, September) and the University of Michigan consumer sentiment index (November, preliminary).
Non-farm job openings declined 659,000 in August from July’s record 11.1 million. In April last year, openings were 4.6 million.
Consumer sentiment dropped 1.1 percentage points m/m in October to 71.7 percent. This is lower than the post-pandemic low of 71.8 percent reached in April last year.
WTI crude oil: Currently net long 434.8k, down 14.8k.
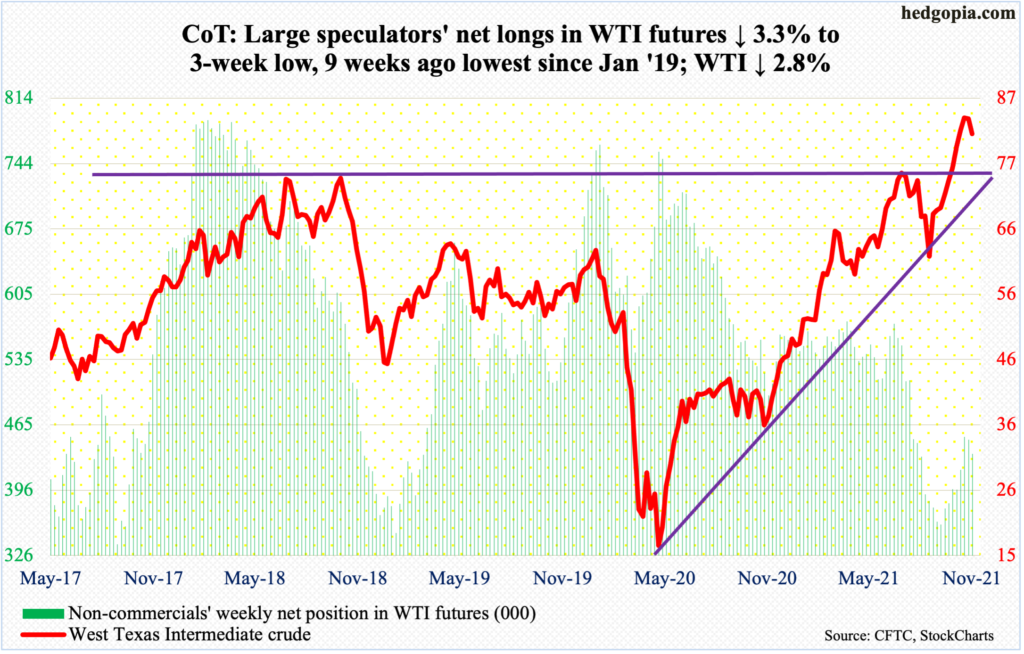
Last week, after nine consecutive up weeks, WTI ($81.27/barrel) edged 0.2 percent lower, forming a spinning top. Bears seized on this and pushed the crude lower 2.8 percent this week.
As recently as August 23, WTI traded at $61.74. On October 25, it ticked $85.41. Conditions are overbought. On Wednesday, a rising trend line from the August low was breached.
Bulls’ mettle will be tested just south of $77, and $74-$75 after that, with the 50-day at $76.42. On Thursday, WTI dropped to $78.25 intraday before drawing bids.
Meanwhile, the EIA report for the week of October 29 showed US crude production increased 200,000 barrels per day to 11.5 million b/d. Stocks of crude and distillates rose, too – respectively up 3.3 million barrels and 2.2 million barrels to 434.1 million barrels and 127.1 million barrels. Gasoline stocks, however, fell 1.5 million barrels to 214.3 million barrels. As did crude imports, which decreased 82,000 b/d to 6.2 mb/d. Refinery utilization rose 1.2 percentage points to 86.3 percent.
E-mini S&P 500: Currently net long 125.5k, up 29k.
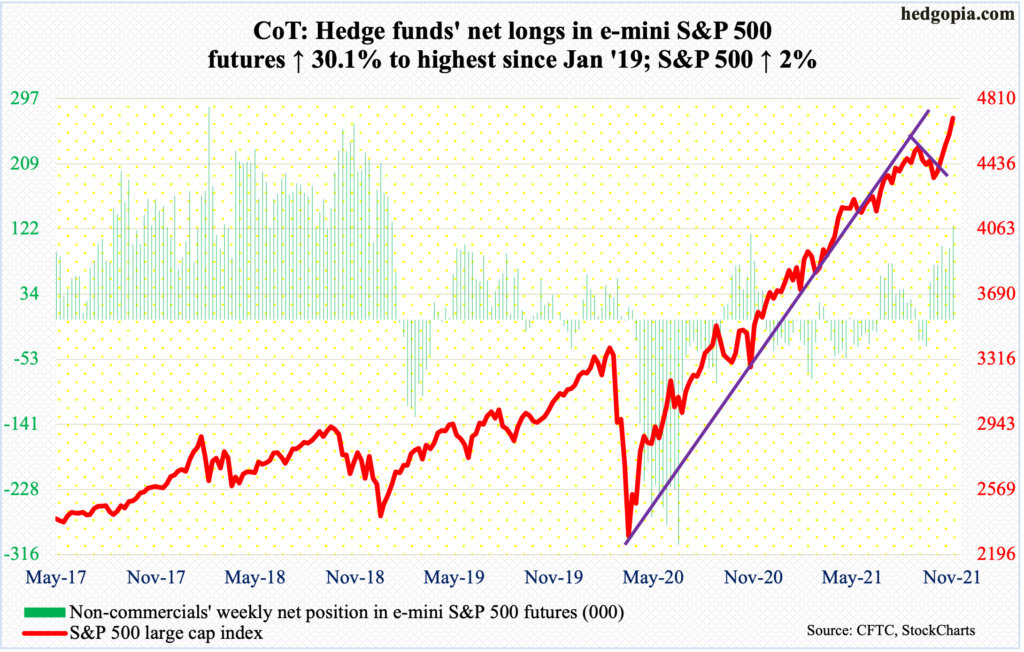
September’s outside month in which the S&P 500 dropped 4.8 percent is quickly turning into a blip. The large cap index faced resistance at 4540s in August and September. Come October, it bottomed early – on the 4th – and proceeded to break out to rally 6.9 percent for the month. With four sessions in, November is already up two percent. From last month’s low through Friday’s high, the large cap index is up just north of 10 percent!
The point is, equity bulls continue to possess the momentum ball. And flows are cooperating. In the week to Wednesday, US-based equity funds took in $2.1 billion (courtesy of Lipper). This followed inflows of $32.6 billion in the prior four. Similarly, in the week to Wednesday, SPY (SPDR S&P 500 ETF), VOO (Vanguard S&P 500 ETF) and IVV (iShares Core S&P 500 ETF) gained $4.7 billion (courtesy of ETF.com). In the prior two, they gained $17.1 billion.
These inflows could very well be positioning for the seasonality factor which tends to favor longs (more on this here). This is also the case with non-commercials who are sitting on net longs that are the highest since January 2019. This also suggests potentially reduced buying power as the year winds down. The downside to all this is that this has further pushed the index into extended territory. The daily RSI crossed 76 on Friday. A giveback is due.
On Friday, the index rose as high as 4719 but sellers took advantage of the strength, closing the session at 4698 with a spinning top.
As things stand, imminent breakout retest at 4540s is crucial.
Euro: Currently net short 6.1k, down 5.1k.
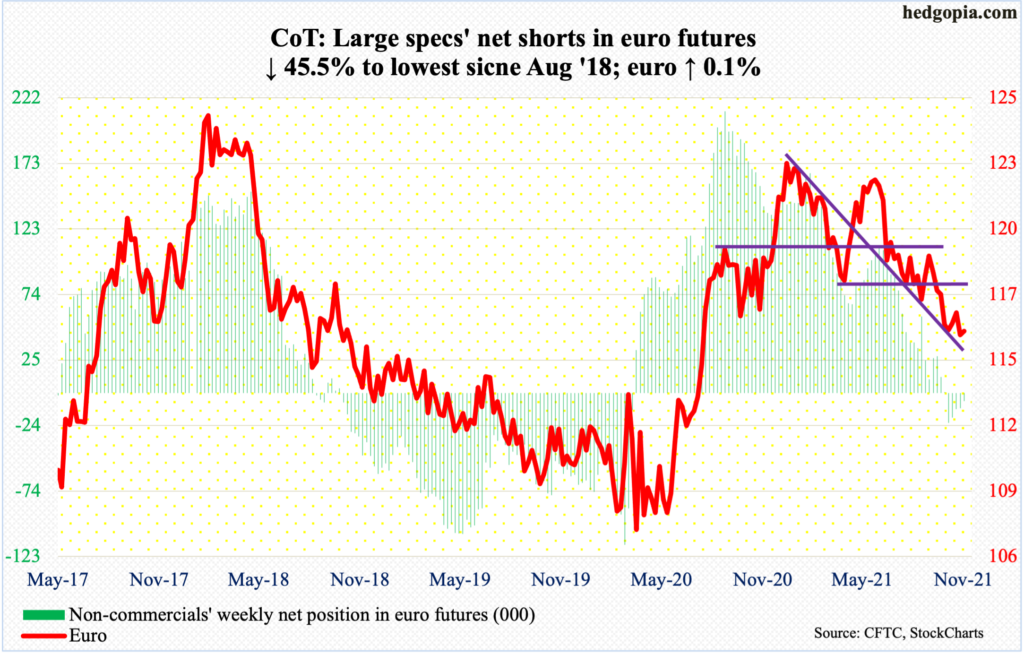
The October 12th low of $1.1525 was once again tested. Friday’s low of $1.1514 undercut that low as well as last Friday’s low of $1.1535.
Horizontal support just south of $1.15 goes back 18 years and is holding firm thus far. Thursday produced a long-legged doji right at the daily lower Bollinger band, while Friday reversed slightly higher from just under the band.
The euro ($1.1568) came under pressure after peaking at $1.2345 in January this year and has gone sideways just above $1.15 the last five weeks. This is an opportunity for the bulls to put their foot down. So far so good. A spinning top formed on the weekly.
Gold: Currently net long 215.1k, up 569.
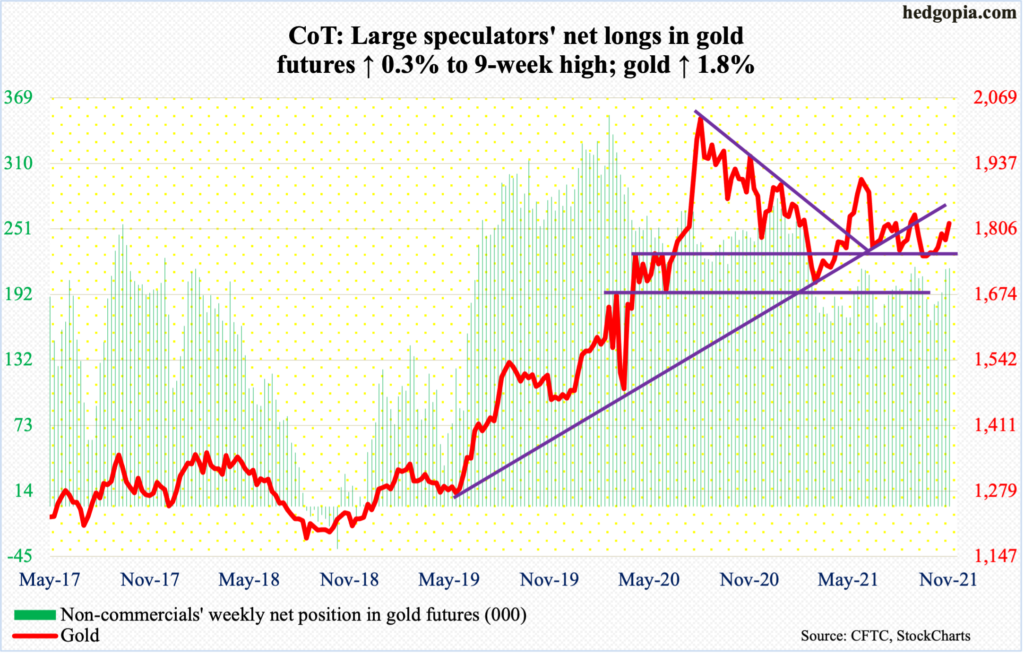
One more week of successful defense of straight-line support at $1,760s-$1,770s. This took place on Wednesday and was followed by Thursday’s 1.7-percent rally to essentially close right on the 200-day. The average then got taken out on Friday, with the metal closing at a two-month high.
Gold peaked at $2,089 in August last year. A falling trend line from that high will be broken at $1,820s. The yellow metal closed the week at $1,817 – essentially at that trend line. A breakout has the potential to break the logjam the yellow metal is under.
Encouragingly for gold bugs, since it bottomed at $1,676 in early August, gold has made higher lows, with Wednesday’s low of $1,758 just about testing the trend-line support. So, in essence, gold is trapped between these two trend lines, with favorable breakout odds so long as $1,760s-$1,770s remains intact.
Nasdaq 100 index (mini): Currently net long 7.2k, up 10.5k.
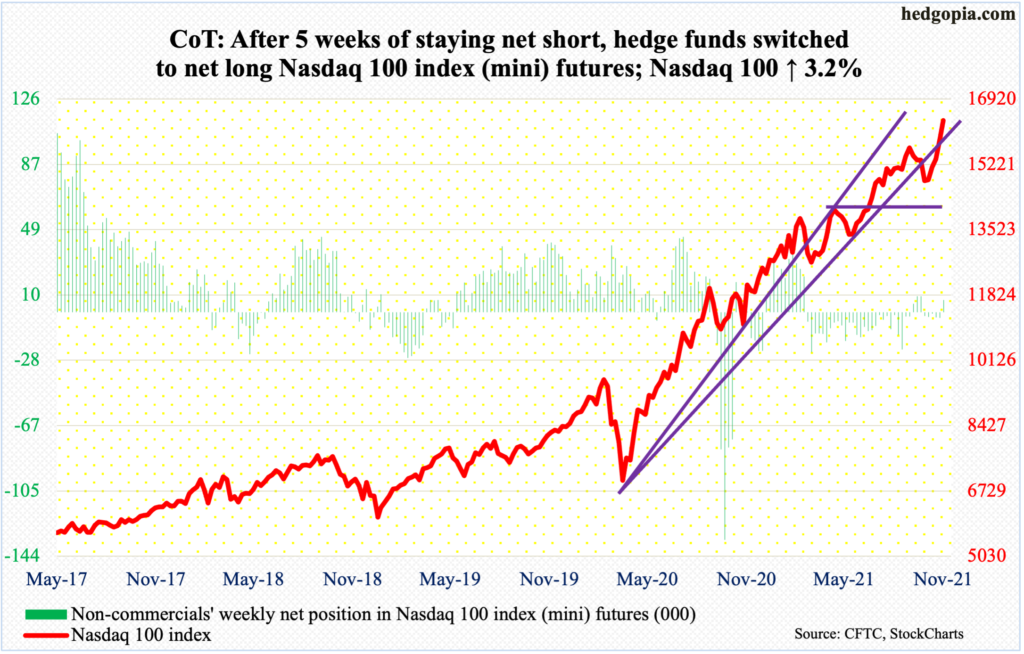
September’s bearish outside month was superseded by October’s bullish outside month. With five sessions in, November is already up 3.2 percent, pulling further away from the most recent breakout at 15700s. Monday’s low of 15785 came close to testing the breakout, and this was followed by four positive sessions in succession.
With that said, Friday’s trading deserves some attention. The tech-heavy index (16359) was up as much as 0.7 percent, posting a new high of 16454, but ended the session up 0.1 percent. The daily RSI is north of 78. Conditions are extended. Fatigue could be setting in.
Russell 2000 mini-index: Currently net short 38.2k, down 16.3k.
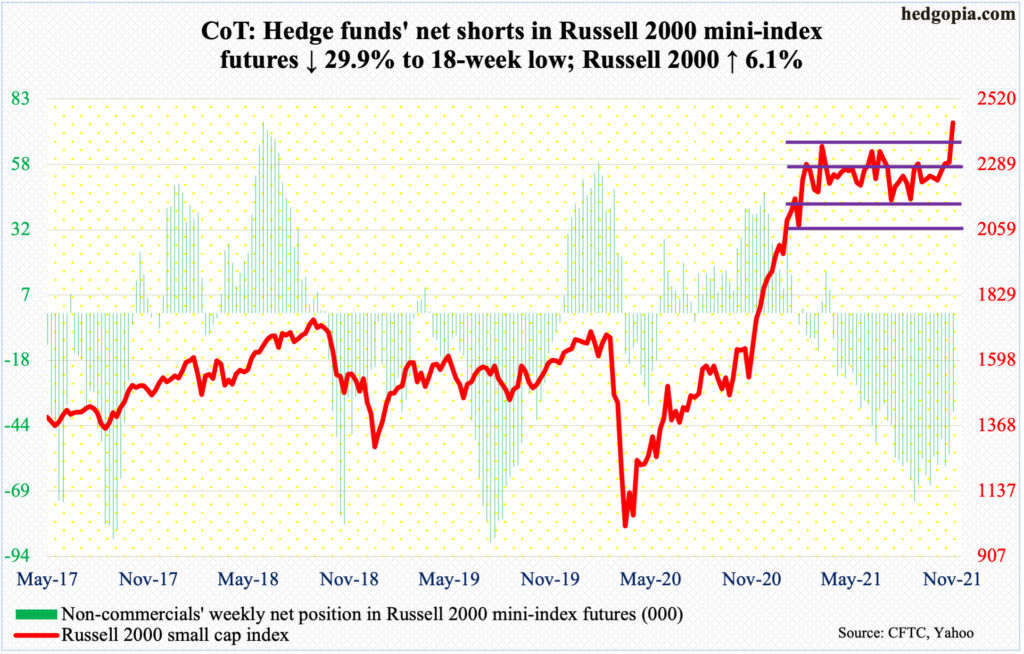
The Russell 2000 started out strong with Monday’s 2.7–percent rally but it was not until Wednesday a major breakout occurred. For nearly eight months now, the small cap index has been rangebound between 2350s and 2080s, and between 2280s and 2150s within this rectangle.
Wednesday’s 1.8-percent rally made sure the index convincingly broke out of the months-long consolidation. Prior to this, it surged 144 percent in a year post-March 2000 bottom. The digestion of these gains took nearly eight months to resolve to the upside.
If it is a genuine breakout, the measured-move target on the Russell 2000 (2437) is 2600 – at least the technically-oriented bulls would be eyeing this.
Non-commercials are front and center. As of last Tuesday, they were sitting on 54,431 net shorts in Russell 2000 mini-index futures. This week, holdings dropped to 38,171 contracts. It smells like a squeeze, but at the same time the breakout in the cash took place on Wednesday, so it is possible more shorts left by the end of the week. Next week’s report can shed more light on this.
US Dollar Index: Currently net long 35k, up 525.
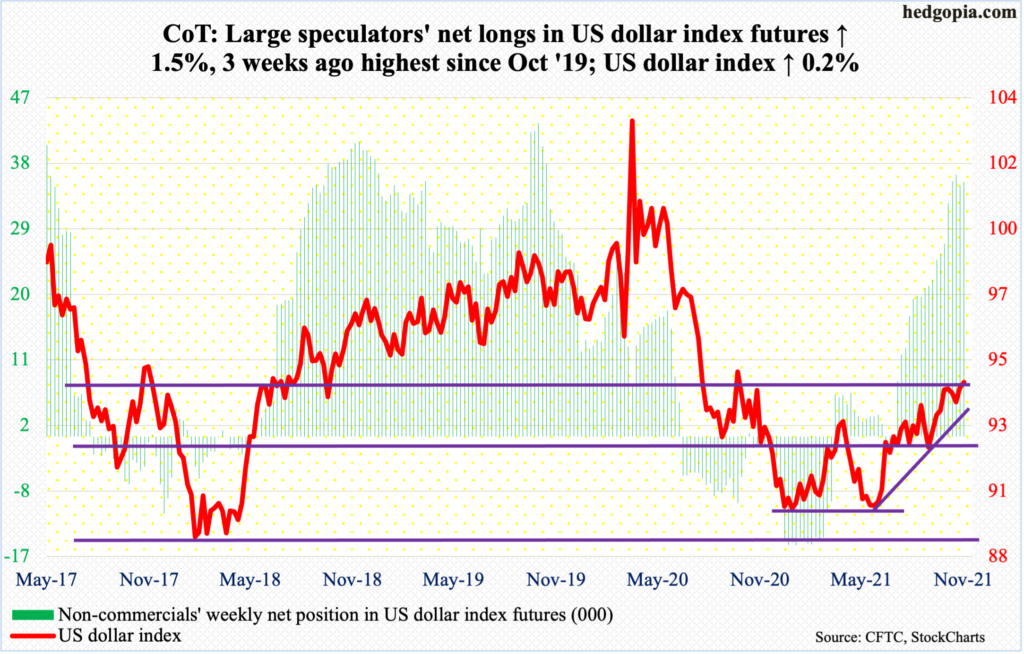
For six weeks, the US dollar index (94.32) has tried to break out of 94.50s. On Friday, it rallied to 94.64 before retreating just north of the daily upper Bollinger band.
It is important to remember that both in January and May this year, dollar bulls defended 89. Horizontal support at 88-89 goes back 15 years, if not longer. So, a decisive breakout – should one occur – could prove to be important, as this could eventually open the door toward 98.
VIX: Currently net short 103.3k, up 1.7k.
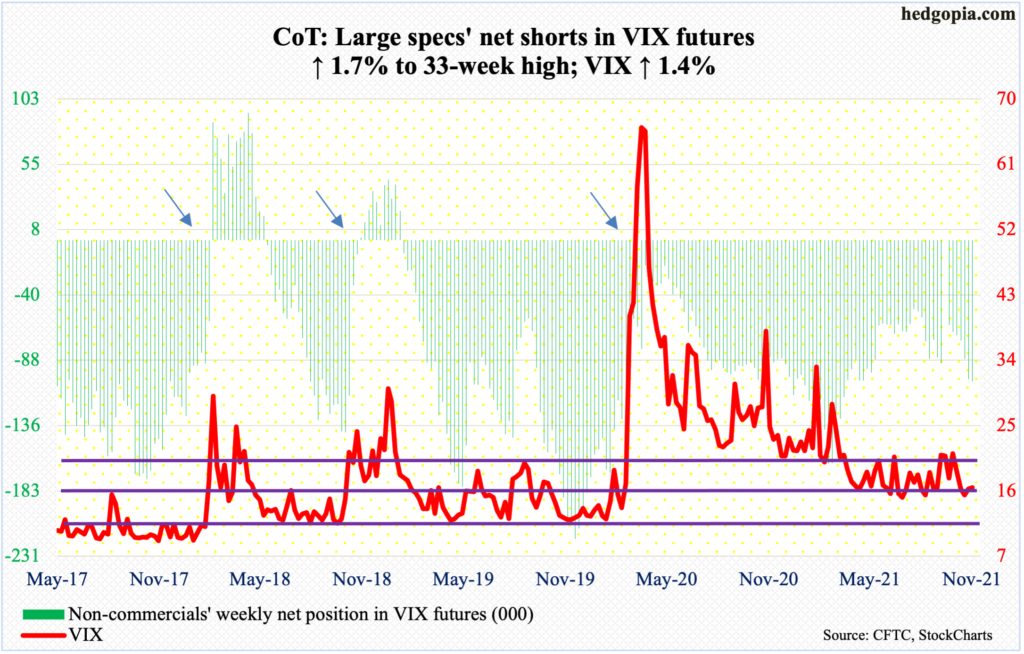
VIX (16.48) is itching to rally.
In the last couple of weeks, the volatility index went sub-15 several times. This again occurred on Wednesday through Friday this week. Friday’s intraday drop to 14.95 resulted in an intraday reversal to the upside, ending the session at 16.48. The daily MACD just had a potentially bullish crossover. As well, on the daily, a potentially bullish crossover between the 10- and 20-day looks imminent.
Thanks for reading!
