
Bears are putting foot down. On both the S&P 500 and Russell 2000, bulls last week were unable to break through multi-year resistance, even as the Nasdaq 100 finished right on rising-channel support from March. All this followed massive gains – between 64 percent and 84 percent – over the past five and a half months, driving several metrics into uncharted territory. Near-term notwithstanding, imminent unwinding will put bulls’ mettle to the test.
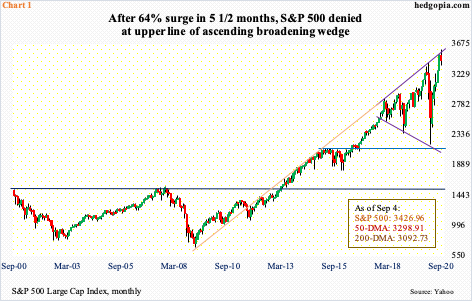
From the March 23rd low through last Wednesday’s record high 3588.11, the S&P 500 large cap index surged 63.7 percent. The gains are even more impressive considering the time it took – less than six months.
Two weeks ago, the index broke through the prior high from February, and rallied another 5.7 percent in no time, before a potentially important technical pattern came in the way last week. Since January 2018, the S&P 500 has traded inside an ascending broadening wedge, which also lines up with the underside of a broken trend line from March 2009 (Chart 1).
This year’s February-March selloff stopped at the lower line of the wedge. Last week’s high kissed the upper line and was immediately rejected. It was as if sellers were waiting for this to test to take place before pressing the sell button. Intraday Friday, the index tagged 3349.63, but by close the February high was saved. Given how extended the index is, a breach is just a matter of when not if.
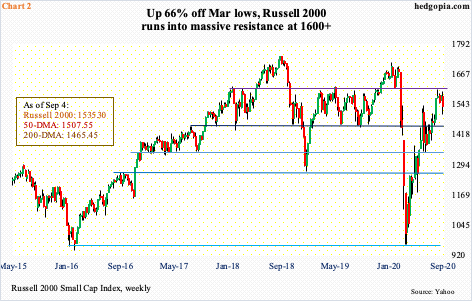
Similar dynamics are in play on the Russell 2000 small cap index. Unlike most other major US equity indices, the Russell 2000 peaked as far back as August 2018 at 1742.09. Just before the February-March selloff this year, it rallied to 1715.08 for a lower high. The selloff picked up speed in late February once bears took control of 1600-plus, which has been an important price point going back to January 2018 (Chart 2).
The February-March selloff stopped at 966.22 on March 16, which was a successful test of the low from February 2016. After the March bottom this year, the index then rallied 66 percent, stopping at 1603.60 on August 11.
It increasingly feels like small-cap bulls have run out of ammo. Nearest support lies at 1450s-60s, and 1340s-50s after that.
Immediately ahead, the question is if last week’s action begins to make a dent in investor sentiment, which remains elevated.
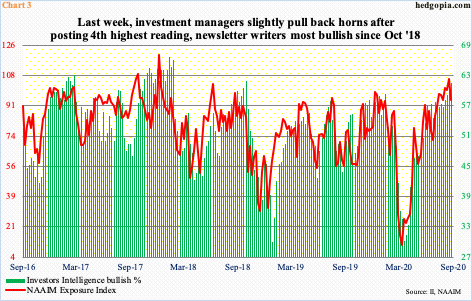
As a matter of fact, the NAAIM (National Association of Active Investment Managers) Exposure Index, which measures members’ average exposure to US equity markets, fell 11.85 points week-over-week last week (Chart 3). This was right before stocks sold off in the latter two sessions. The prior week’s 106.56 was the fourth highest reading in the series’ 14-year history. These are pros who manage money for a living and are sitting on tons of profit. In the week to March 18, which was the week before the S&P 500 bottomed, the index dropped to 10.65.
Concurrently, newsletter writers, whose sentiment is captured by Investors Intelligence, kept pressing last week. Their bullish count rose 1.5 percentage points w/w to 61.5 percent, which is the highest print since October 2018. In the week to March 24, bulls were merely 30.1 percent.
One catalyst could come from the Nasdaq 100 index.
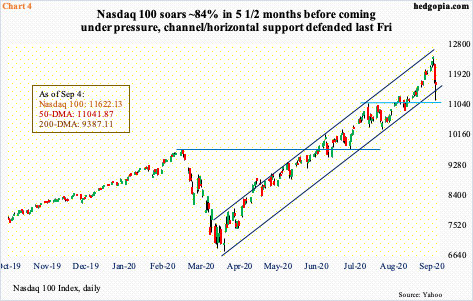
Off the March bottom in particular, tech led by a wide margin. The Nasdaq 100 is up nearly 84 percent (no typo) in the past five and a half months. These are heady gains and primarily resulted from outperformance by leaders such as Apple (AAPL), Microsoft (MSFT) and Amazon (AMZN). The soldiers are not keeping up. The percent of Nasdaq 100 stocks above the 50-day peaked as far back as June 2 at 98 percent, even as the index continued higher. Several times in the past, the leaders in due course have shown a tendency to catch up with the soldiers (more on this here); last Friday, only 60 percent were above their 50-day.
Until last Wednesday when the Nasdaq 100 posted a fresh high of 12439.48 the divergence continued; the session also formed a dragonfly doji, which is a candle that can signal potential reversal. The index remains overbought on nearly all timeframes. Nearest support lies at 11000, which approximates the 50-day at 11041.87. Last Friday, the index dropped as low as 11145.99 before buyers showed up; this helped the index essentially close on channel support from the March low (Chart 4). Selling likely accelerates once this gives way. This has the potential to seriously dent investor sentiment.
Because they were able to defend important support in the face of severe selling pressure last Friday, it is possible bulls try to regroup and put up a fight near term.
The Nasdaq 100 (11622.13) will test its 10-day at 11946 and the S&P 500 (3426.96) its at 3484. The Nasdaq 100 is slightly above the 20-day (11598) and the S&P 500 slightly under (3429). The Russell 2000 (1535.30) is below both the 10-day at 1566 and the 20-day at 1570.
In the event these indices rally toward their respective 10-day this week, there is room for volatility to come in a little.
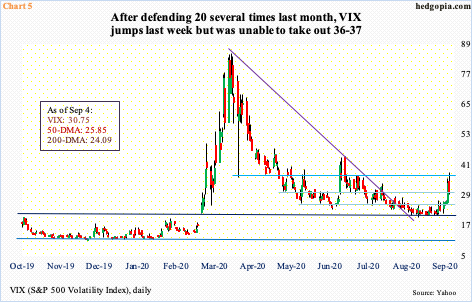
VIX rallied big last week, up 7.79 points. This was preceded by two back-to-back weekly long-legged dojis and a spinning top before that. Longer-term, on the monthly, several indicators including the RSI are hooking up from the median. Volatility is ready to perk up.
That said, near term, the daily is beginning to look extended. Last Friday, VIX rose as high as 38.28, but momentum soon petered out. There is decent resistance at 36-37, and it held. Nearest support lies at 30-31, which is where VIX (30.75) closed last week (Chart 5). Then comes the 200-day at 28.36 and the 50-day at 25.70, with the latter approximating straight-line support.
If equity bulls fail to muster strength to even test the 10-day on the indices above, odds grow a 10/20 cross-down will develop, which will have swung momentum in bears’ favor.
Some metrics are out-and-out frothy.
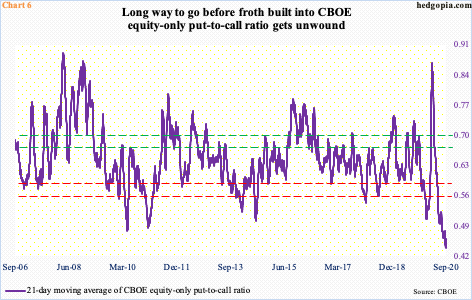
News circulated last week about how SoftBank made massive bullish bets on US tech stocks using call options. This probably explains the relentless suppression of the CBOE equity-only put-to-call ratio for three months now.
The 21-day moving average of the ratio dropped to 0.439 – a new low – last Wednesday, with the week closing out at 0.46 (Chart 6). Sentiment has done a 360 in less than six months. On March 20, the ratio shot up to 0.867, reflecting pervasive fear. Now, greed has taken over.
Because an excessive use of derivatives created a self-fulfilling prophecy that put upward pressure on equities, flows pretty much did not matter this time around.
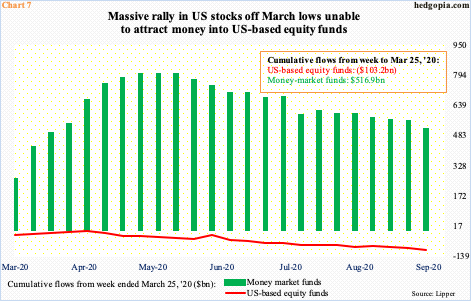
From the week ended March 25 through last Wednesday, US-based equity funds lost a cumulative $103.2 billion, even as $516.9 billion moved into money-market funds (Chart 7). In fact, through the middle of May, $801.1 billion had moved into money-market funds; not much of the money that left these funds since then managed to find a home in equities, even though the latter was in an uptrend. This raises the odds that once selling begins in earnest, the urge to lock in gains can rise meaningfully.
Shorter-term averages on the three equity indices above are therefore worth watching, not to mention the channel support on the Nasdaq 100.
Thanks for reading!
