
- 200-day moving average perceived by many as demarcation line between bull and bear market
- VIX surges past 17-18 and nears two-year-plus 21-22 resistance, but yet to retreat
- (Re) action at/near previous breakdown points to decide who wins out
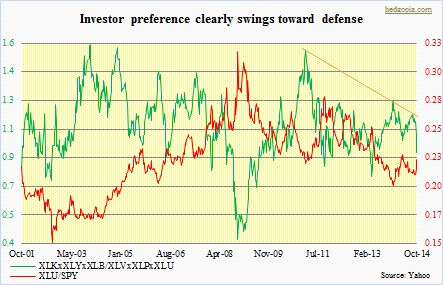 Defensive sectors continue to outshine offensives. Since September 19th, when the S&P 500 Large Cap Index peaked intra-day at 2019, consumer staples and utilities are the only two sectors that are in the green. Amidst this, major U.S. indices are either sitting on or just underneath a level that many market participants, rightly or wrongly, perceive as a separator between a bull and bear market. We are talking about the 200-day moving average. Even non-technicians watch this average closely. A convincing break can be taken to mean stocks’ major trend has turned down. At times, a break is indeed followed by a waterfall decline. Most recently, we saw this unfold in the Russell 2000 Small Cap Index, which broke its 200-day mid-September, and has since shed another eight-plus percent. With that said, the metric is not fool-proof. Nothing is. Otherwise, making money would be a lot easier. Lots of times, by the time the average is broken, stocks would have already dropped by a decent amount. Stops get taken out. Algorithmic trading gets active. And by that time sellers are all gone. A washout of sorts.
Here is where we stand currently. 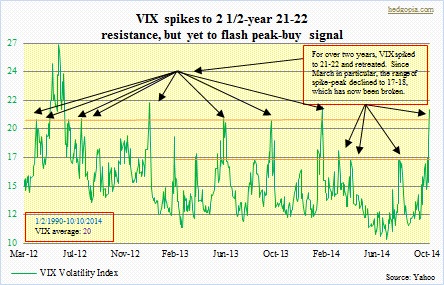 Of the three major indices, the Dow Industrials (16544) lost its 200-day last Friday. Ditto with the Nasdaq Composite (4276). Not by a whole lot, though – by less than 50 and 24 points, respectively. The S&P 500 (1906) is literally sitting on it. From a bull’s perspective, this is a little worrisome. In a strong trending market, it is normal to test that average; even more normal would be a trampoline-like bounce off it. Which occurs if there are willing buyers ready to pounce on the opportunity. Mid-April this year, the Nasdaq tested its 200-day intra-day and bounced right off. This was the first test since November/December 2012, and even back then a brief breach was followed by a sustained rally. That was also when the S&P 500 last tested that average. Back then, as was the case with the Nasdaq, there was a brief breach, followed by a rally. The Dow is a little different. Since late 2011, it has breached the average several times, but only briefly. Hence particularly on the S&P 500 and Nasdaq, since the Friday test was taking place after a long time, one would have hoped buyers would step up to the plate. Apparently not. Sellers are overwhelming buyers.
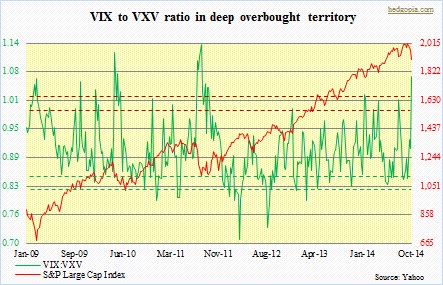 Fear is palpable in the markets, reflected in the VIX. Although it is not off the charts. Yes, it has shot up – past the 17-18 level, which since March this year repelled VIX spike three times. The current level is equally important. Since 2012, except once, the “fear index” has tended to retreat after reaching 21-22. But if 17-18 did not hold, what is the guarantee that this one would? None. As a matter of fact, the Friday spike was not sold. Not very encouraging if you are a bull. The VIX to VXV ratio suggests market participants are seeking near-term protection. The VIX measures S&P 500 volatility for the next 30 days, while the VXV looks at volatility for the next three months. In normal times, premium for longer duration tends to be higher (known as contango). There are also times when market participants are so fearful something bad might happen near-term they are willing to pay up for that protection (results in backwardation). As shown, this is where we are at the moment. A rising ratio means premium for near-term protection is rising faster. Typically, that has been a place to go long equities.
Will it work this time around?
Here is a possible scenario. After a breach of the 200-day, indices stay underneath the average for two to four days and stabilize, before drawing in buyers. Even under this scenario, where we are now it is hard to argue for a sustained rally – the kind we have consistently experienced in the current bull market. There have been trendline breaks. And importantly, last week’s rally attempts were sold/shorted at important technical levels/where things previously broke down. This reflects a change in sentiment. Once things stabilize, what follows near/at previous breakdown points will serve as an important telltale as to if bears have taken over.
