
Fed chair made it clear last week that things have not deteriorated enough for them to act. In this atmosphere, the 10-year rate can head toward two percent. Equities, in all probability, will not like that, even though they are oversold near term.
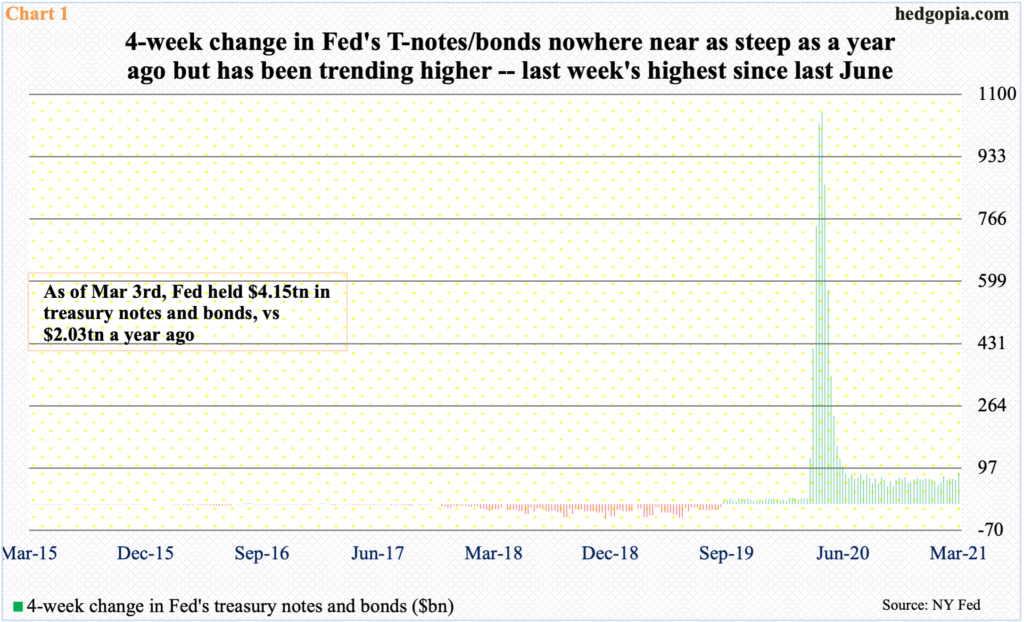
In the week to last Wednesday, the Federal Reserve purchased $19.9 billion in treasury notes and bonds, to $4.15 trillion. A year ago, it held $2.03 trillion in these securities. Back then, the central bank was buying so aggressively that in April its holdings went up by $1 trillion over four weeks. On that basis, the pace has slowed down. That said, last week’s four-week change was $85.6 billion, which was the highest since last June (Chart 1).
Treasury rates on the long end have been firming up. It is too soon to say if the Fed is trying to influence the long end of the yield curve by increasing their purchases of notes and bonds. Last Thursday, Chair Jerome Powell essentially said at a public event that he is not too worried by the recent uptrend in long rates. After all, the Fed has been spending up to $120 billion/month in purchases of mortgage-backed securities and treasury notes and bonds.
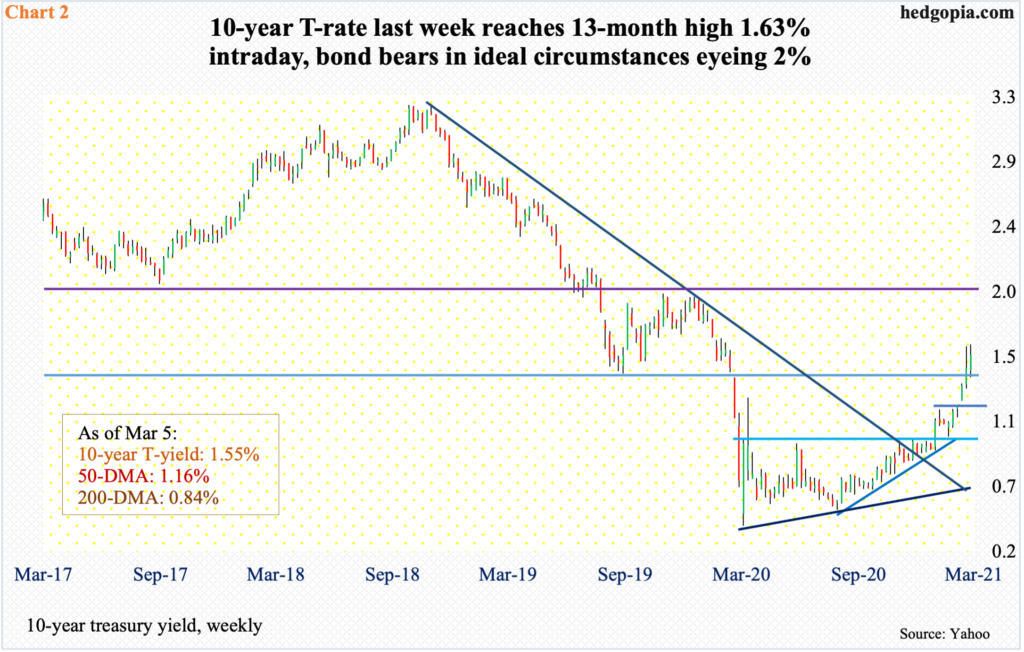
On the day Powell spoke, the 10-year yield touched 1.63 percent intraday before settling down at 1.55 percent. This was the second time rates crossed 1.6 percent in a week before pulling back.
A year ago when Covid-19 fears were pervasive, stocks were in free fall and bonds were getting bid up, the 10-year bottomed at 0.4 percent. Since that low, rates have steadily climbed higher, breaking out of one percent in the first week of January. Mid-February, bond bears (on price) took care of 1.2 percent and then 1.4 percent two weeks ago (Chart 2).
As things stand, markets are clamoring for some version of Operation Twist, in which the Fed sells short-term notes and buys long-term notes and bonds – some level of yield curve control in which the long end is capped.
Right here and now, Powell is saying no to that. If he sticks to his guns, the 10-year rate could very well head toward two percent in due course. Eventually, markets have a way of getting their own way – sooner or later. That was true with Alan Greenspan, true with Ben Bernanke and true with Janet Ellen. Unless Powell shows the fortitude of Paul Volcker when the time comes, markets will end up leading the Fed. They will do so by throwing tantrums in both the bond and stock markets.
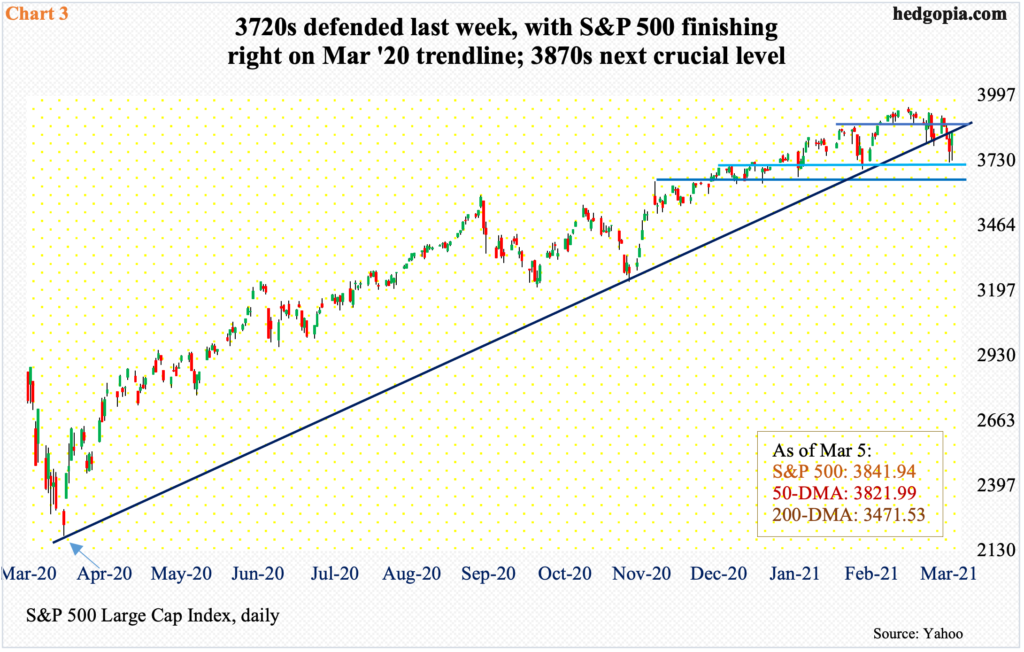
The 10-year broke out of 1.2 percent on February 16 and that was the day the S&P 500 peaked at 3950.43. In the selloff that followed, the large cap index dropped to 3723.34 at last Thursday’s low, down 5.8 percent – mini-tantrums of sort.
In so doing, the S&P 500 (3841.94) on Thursday not only lost the 50-day moving average but also a rising trend line from last March (Chart 3). This rather nervous action continued on Friday, except to reverse intraday to finish up two percent, past the 50-day but right on that trend line.
Immediately ahead, on the daily, there is room for a rally. What transpires around 3870s-80s will tell us a lot about where things are headed near term. A retreat from that level can form the right shoulder of a potentially bearish head-and-shoulders formation, with the neckline at 3720s, a breach of which opens the door to 3640s, which is where the S&P 500 peaked on November 9 when Pfizer (PFE) announced its positive vaccine news.
From this respect, how tech and small-caps behave in the sessions ahead can be telling. Tech because the sector is home to the leading US companies and small-caps because of its clean exposure to the domestic economy.
In QQQ (Invesco QQQ Trust), Apple (AAPL), Microsoft (MSFT), Amazon (AMZN), Alphabet (GOOG/L), Tesla (TSLA) and Facebook (FB) together account for 43.9 percent – and 23 percent of SPY (SPDR S&P 500 ETF).
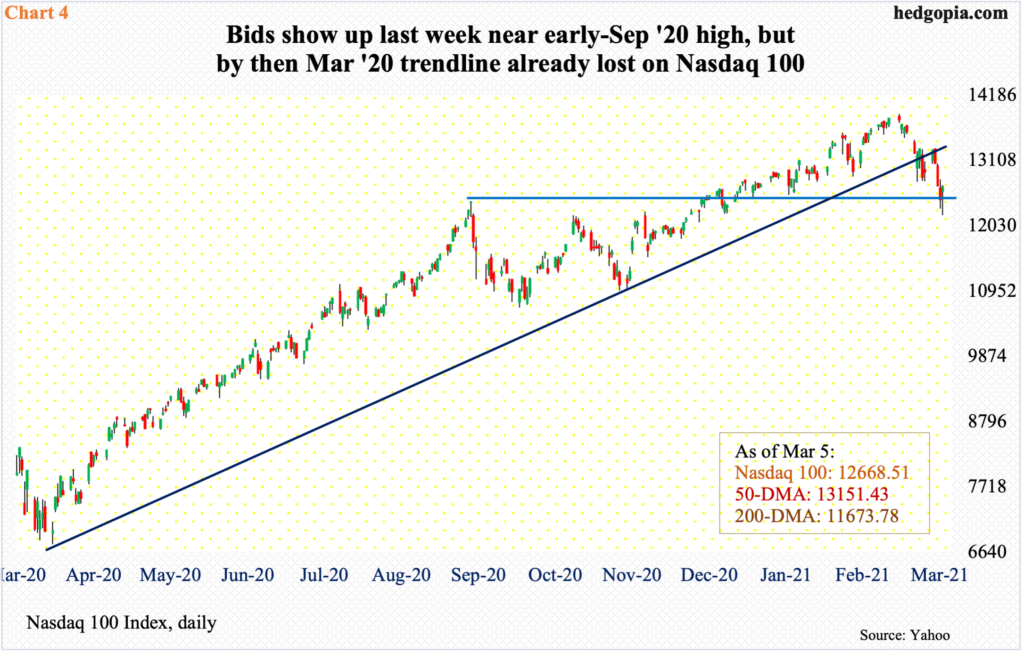
Tech has struggled this year. The Nasdaq 100, too, peaked on February 16 but signs of distribution were there before that, with January forming a monthly long-legged doji and February a shooting star.
Last Friday, the index (12668.51) reversed higher with a daily hammer, defending the prior high from last September (Chart 4). But the March trend line has been breached. the Nasdaq 100 remains under the 50-day (13151.43); the average can act like a magnet in the sessions ahead.
Speaking of which, GOOG is the only one of the six that is above both the 50- and 200-day. AAPL and TSLA are caught between the averages. MSFT, above the 200-day, rallied above the 50-day last Friday. FB rallied above the 200-day last Friday but remains under the 50-day. AMZN is below both the 50- and 200-day.
In other words, the bigwigs are beginning to show cracks here and there.
Then, there is the Russell 2000. By nature, small-caps have more domestic exposure than their large-cap brethren. In essence, their performance is a reflection of how the collective wisdom of markets thinks where the US economy is headed.
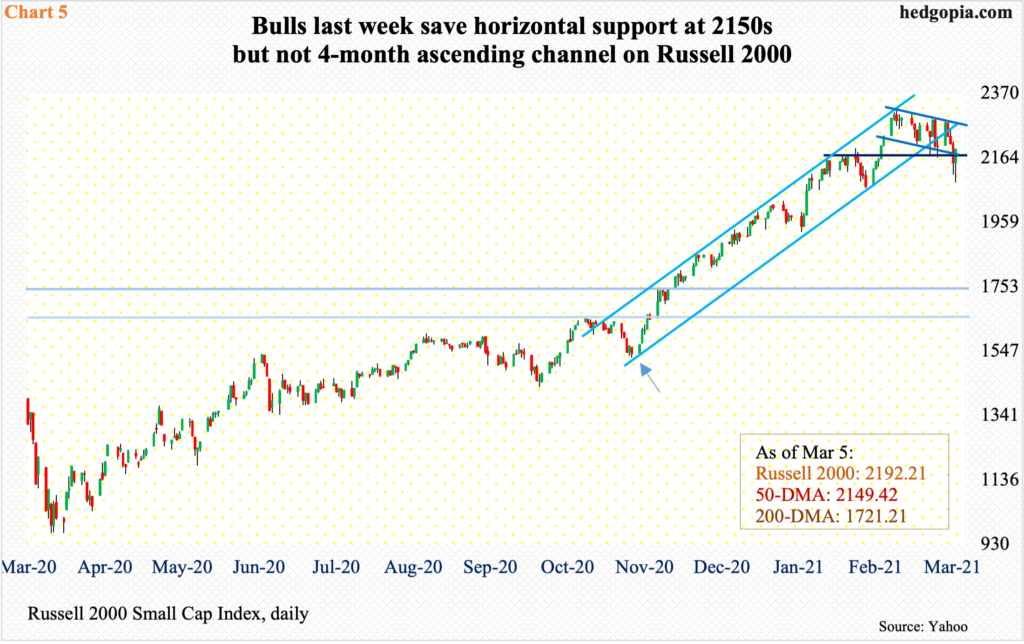
Last March, the small cap index bottomed at 966.22. The rally that followed paused at just north of 1600, which has proven to be an important level going back to January 2018. This resistance fell on November 6 when two Georgia Senate runoff races were both won by the Democrats, essentially giving them control of both chambers of Congress as well as the White House. On the 9th that month (post-PFE news), the Russell 2000 took out its prior high of 1740s from August 2018 (Chart 5).
Post-vaccine news in particular, investors rerated growth expectations. The sooner the economy gets back to normal, the better it is for the sector. S&P 600 companies are expected to earn $61.58 this year, versus a loss of $4.67 last year.
Hence the significance of their price action going forward, which should be taken as a reflection of not only their growth prospects but also how much of this optimism is in the price. From last March’s low through a new all-time high of 2318.09 set on February 9, the Russell 2000 rallied 140 percent. From that high through last Friday’s low of 2085.12, it then dropped just north of 10 percent, before bids showed up. As with the S&P 500 and the Nasdaq 100, last Friday formed a daily hammer on the Russell 2000. Short-term horizontal support at 2150s was defended, but the index (2192.21) has dropped out of a steep ascending channel from late October-early November last year (arrow).
On all these three indices, weekly and monthly indicators remain grossly overbought. So, on a longer time frame, downside risks outweigh upside potential as these conditions need to unwind. Things are different on the daily, however. There is room to rally near term. It is just a matter of how far bulls can take it off of last Friday’s reversal.
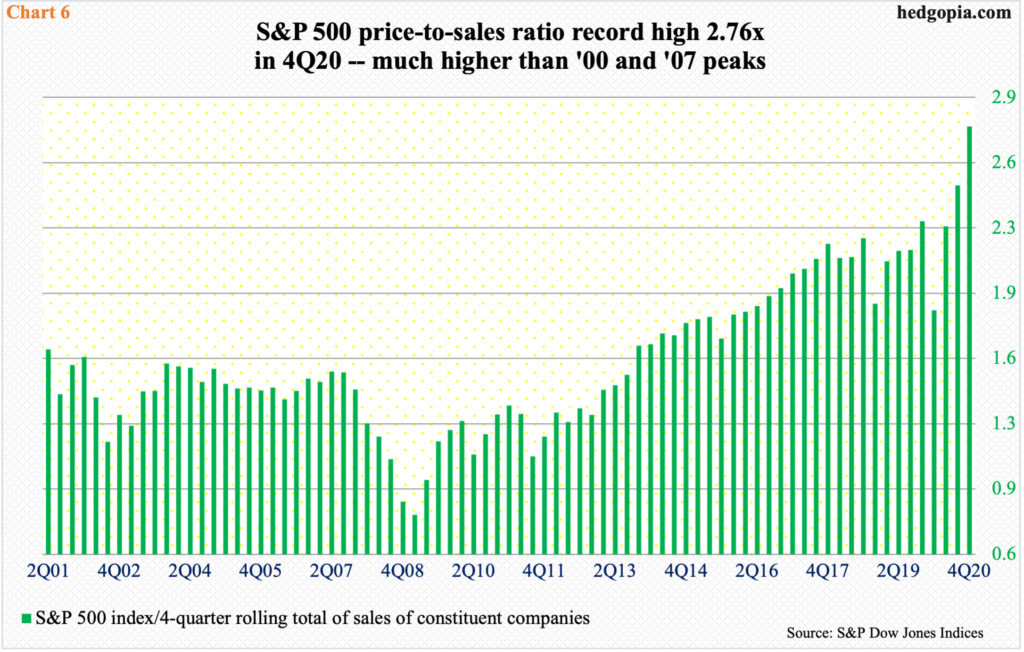
Bears likely will try to show up at the aforementioned 3870s-80s on the S&P 500 and the 50-day on the Nasdaq 100. At this point, bulls can no longer make the valuations argument, with the price-to-sales ratio of 2.76x in 4Q20 – a new record (Chart 6). It has rather come down to momentum. The longer it persists, the more self-fulfilling prophecy it becomes.
In the last three weeks, momentum has taken a slight hit, but nothing major. Bulls can still repair the damage, but it is going to take quite a bit of regrouping to undo the monthly candles of January and February (more on this here). Of note, when these patterns formed, investor sentiment was effusive.
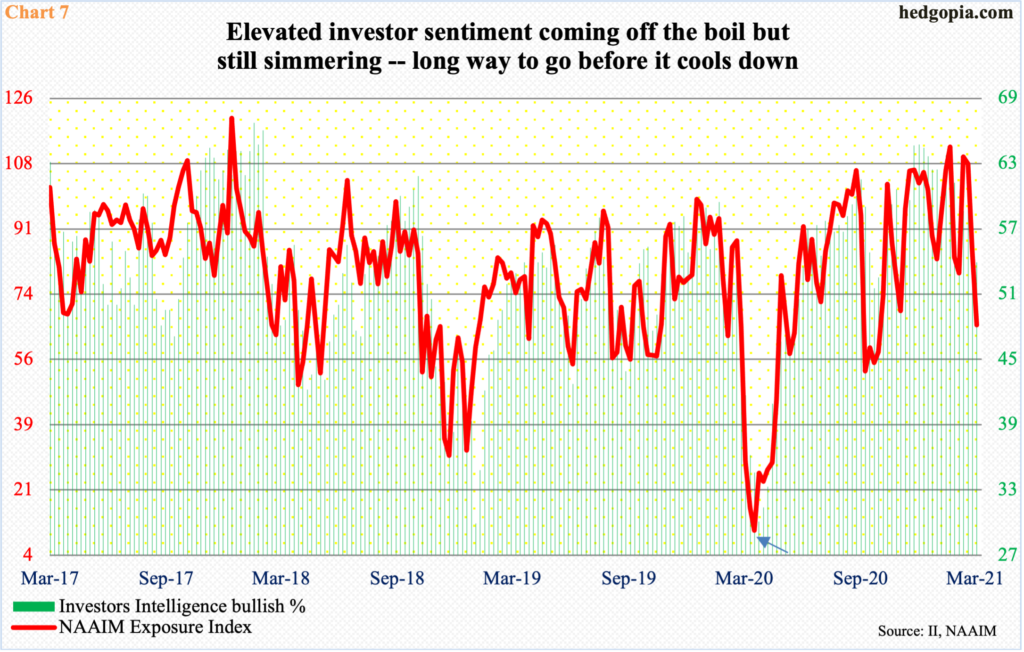
In the 10 consecutive weeks to January 26, Investors Intelligence bulls were north of 60 percent. A week before that, the NAAIM (National Association of Active Investment Managers) Exposure Index hit 112.9, which was the second highest reading in its nearly 15-year history; until now, there have been 29 100-plus readings, nine of whom occurred since mid-November and 13 since last August.
Last week, the NAAIM reading, which measures members’ average exposure to US stocks, declined 19.6 points week-over-week to 65.4, while Investors Intelligence bulls, expressing newsletter writers’ sentiment, dropped 2.4 percentage points to 53.9 percent. They are substantially off their highs but are nowhere near panic levels. In Chart 7, the arrow shows how depressed sentiment was at the lows of last March.
In all probability, the only thing that is preventing sentiment from getting worse is the hope that the Fed will act. At the same time, Powell is indicating that things have not worsened enough for them to blink. This is the risk bulls face in the medium term, particularly if the 10-year heads toward two percent.
The answer to the rhetorical question in the blog title, therefore, is that it depends on the timeframe – buy the dip near term but sell the strength medium term.
Thanks for reading!
