The following are futures positions of non-commercials as of October 20, 2015. Change is week-over-week.
10-year note: At the press conference following the ECB meeting on Thursday, when asked by a WSJ reporter as to why the bank is fighting low inflation which benefits consumers, Mario Draghi, ECB president, said inflation increases the real value of debt. There you go! A forthright answer from a central banker.
Disinflation/deflation hurts debtors. Inflation is one way to effectively reduce the debt load.
In the U.S., for example, federal debt stood at $18.2 trillion in 2Q15, up from $5.7 trillion 15 years ago. A little bit of inflation will go a long way. As do low interest rates. Interest payments of the federal government were only $457 million (at a seasonally adjusted annual rate) in 2Q15, versus $356 million in 2Q00.
U.S. rates will remain suppressed. Particularly so near-term based on what came out of the ECB as well as the People’s Bank of China this week.
Mr. Draghi hinted that additional stimulus might be on the way (more below). A day later, the PBoC cut its benchmark lending rate and reserve requirements for banks. It seems the liquidity punch bowl is being reloaded at least in two major economies, if not globally.
While this may be good for risk-on assets – duration notwithstanding – the fact remains that monetary measures continue to struggle to produce the desired results. Since November last year, this is China’s sixth rate cut. The economy is losing momentum, and prices are slumping.
Amidst all this, it will be difficult for the Fed to maintain a hawkish stance when it meets next week.
Currently net short 37.8k, up 55.5k.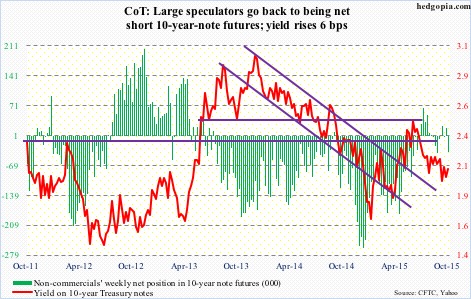
30-year bond: Next week’s major economic releases are as follows.
New home sales for September are published on Monday. This will be coming on the heels of this week’s three housing-related releases, which were all good. Sales of existing homes in September were 5.55 million units at a seasonally adjusted rate, up from 5.3 million in August…September’s housing starts were 1.21 million units (SAAR) – the highest since October 2007…And the NAHB housing market index (builder sentiment) came in at 64 in October, a 10-year high.
Year-to-August, sales of new homes have come in north of 500,000 units (SAAR) in six of eight months, with the 12-month running average of 499,000 in August – the highest since 502,000 in November 2008.
Tuesday, FOMC meeting begins, and concludes the following day. There is no press conference by the Chair. Next one does. The December 15-16 meeting is the last one this year.
The advance report on durable goods for September will be released on Tuesday as well. This series has lost momentum. Orders for non-defense capital goods ex-aircraft, a proxy for business capital expenditures, have contracted year-over-year for seven consecutive months.
Thursday, we will learn how the economy fared in the third quarter. This will be the advance estimate. The consensus expects real GDP growth of two percent. The economy grew 3.9 percent in the second quarter. The Atlanta Fed’s GDPNow model is forecasting (as of October 20th) a 0.9-percent growth. Despite its brief history, the latter does have a good forecasting record.
Also on Thursday comes out the pending home sales index. August was 109.4, down from 110.9 in the prior month, and 112.3 in May.
Friday is busy – on tap are personal income for September, employment cost index for the third quarter, and the University of Michigan’s consumer sentiment for October (final reading)…In August, core PCE was up 1.3 percent. This is the Fed’s favorite measure of inflation. The last time it rose at two percent was in April 2012…In the second quarter, private-sector wages and salaries increased 2.2 percent year-over-year, benefits 1.4 percent, and total comp 1.9 percent…October’s preliminary reading of consumer sentiment was 92.1, up from 87.2 in September. January’s 98.1 was an 11-year high.
Currently net short 3.2k, up 9.9k.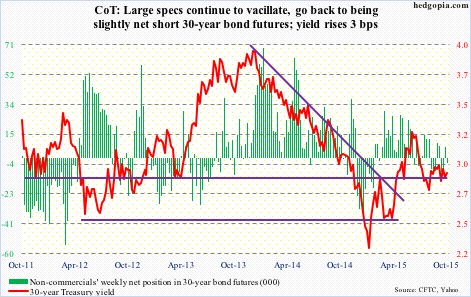
Crude oil: Spot West Texas Intermediate crude fell six-plus percent for the week. News on the inventory front was out-and-out bad.
This is a little old, but Saudi Arabia’s crude stocks were at a record in August – at 326.6 million barrels, up 6.4 million barrels from July. Total production was 10.27 million barrels per day, down from 10.36 mb/d.
Here at home, in the week ended October 16, crude inventory increased by another eight million barrels, to 476.6 million barrels. In the prior week, stocks shot up by 7.6 million barrels. With the latest increase, inventory is now the highest since the May 29th week. It peaked at 490.9 million barrels in the April 24th week.
On the positive side, gasoline stocks fell by 1.5 million barrels, to 219.8 million barrels – now down 4.1 million barrels in two weeks. As well, refinery utilization ticked up, to 86.4 percent from last week’s 86 percent. Utilization has dropped nearly 10 percentage points from 96.1 percent in the August 7th week. Last but not the least, production was unchanged at 9.1 million barrels a day; it peaked at 9.61 mb/d in the June 5th week.
Technically, spot WTI was not able to save support at $47-$48, and on Friday lost the 50-day moving average ($45.05). Support at $43-ish is a must-hold.
Currently net long 269.9k, down 28k.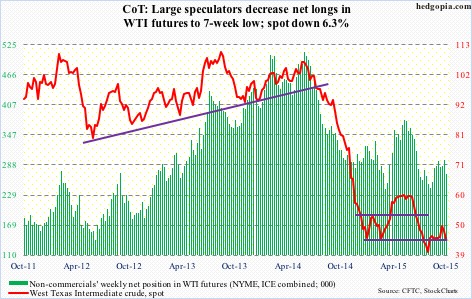
E-mini S&P 500: In the week ended Wednesday, U.S.-based equity funds attracted $4.3 billion – the second straight weekly inflows. In the prior week, inflows were $2.5 billion. This looks good on the surface, but consider this. Since the September 29th intra-day low, the S&P 500 rallied 10 percent. During this period, on a cumulative basis, $2.1 billion has left these funds.
Shorts are probably getting creamed. There is no other way to explain the sharp move in stocks. At the end of September, NYSE Group short interest was the highest since July 2008; on SPY, the SPDR S&P 500 ETF, it surged 58 percent in six months.
Add central-bank activism to the mix, and low 3Q15 earnings expectations. As of October 22nd, operating earnings estimates of S&P 500 companies stood at $28.28 (courtesy of S&P). They were $34.74 at the end of 1Q14, and $31 as early as February this year.
With 34 percent of the S&P 500 companies reporting, 77 percent are beating on the bottom line. No surprise there, given the persistent downward revision. But only 43 percent are beating on the top line (courtesy of FactSet), but revenue is not where investor focus is.
Non-commercials added to net shorts, but this was before the 2.8-percent rally in the S&P 500 in the last two sessions.
Currently net short 259.5k, up 15.1k.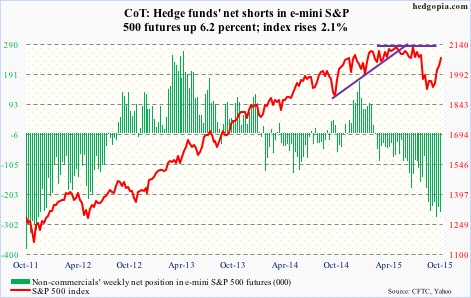
Euro: The euro slumped two percent on Thursday, slicing through both 50- and 200-day moving averages, and another 0.8 percent on Friday. Mr. Draghi got what he probably wanted – a weak currency.
Speaking to the press following the ECB meeting, he said the bank is “ready to act if needed.” This is nothing new. He has expressed similar language in the past.
In addition, he also said that the bank is prepared to provide additional stimulus to raise inflation to its target, probably as soon as December. He is clearly not happy with the trend in inflation. Annual inflation went negative in September in the Eurozone. Mr. Draghi said there is a high degree of correlation between headline inflation and inflation expectations; when the latter drops, real rates go higher. The solution, in their eyes, lies in more liquidity. The strategy has not helped the economy much, but stocks sure like it. On Thursday, the DAX surged 2.5 percent and the CAC 2.3 percent, just to name two indices.
This week’s action has the currency breaking a seven-month rising trend line.
Currently net short 62.6k, down 18k.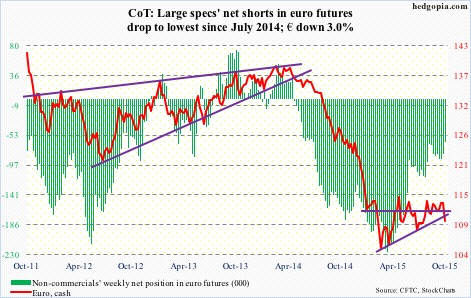
Gold: News of possible additional stimulus in the Eurozone and the easing in China was no help to gold. A case of once bitten, twice shy? Despite all the liquidity sloshing around globally and constant central-bank talk that they would like higher inflation, the latter is a no-show. Gold sensed this as early as four years ago. The metal peaked in September 2011, shortly after QE2 (in the U.S.) ended, and never got going once QE3 got underway in September 2012.
Or it may just be a case of technicals taking over. Gold had rallied seven percent in 11 sessions ended last Thursday, closing the week right near resistance. Overbought as it was, come Monday, it was not able to save its 200-day moving average. On Friday, it opened up reacting to the China news, but the initial strength was sold right off the bat.
Support at $1,140-ish could be in play neat-term. The corresponding support on GLD, the SPDR Gold ETF, is on $110-ish.
In the meantime, non-commercials continue to add to net longs.
Currently net long 151.3k, up 34.1k.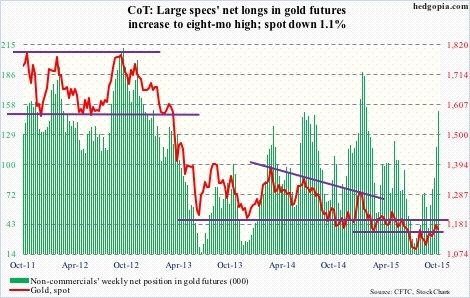
Nasdaq 100 index (mini): It is not too often behemoths like MSFT, GOOGL, AMZN, and TXN shoot up five to 10 percent in a single session. Yet that is what has happened! Call it a rush to own large-caps, shorts getting squeezed, or fundamentally-driven, their earnings have been perceived very well. The day after they reported, stocks rose 10 percent, nearly six percent, six percent, and nearly 12 percent, in that order. (Even MCD, which is NYSE-listed, was up nearly eight percent.)
In the process, if October closes at the current level, the Nasdaq 100 would have scored a record monthly close. It is up 10.6 percent so far this month. Wow! With that said, Friday produced a daily doji right outside the upper Bollinger band. Conditions are grossly overbought near-term, which is true with other indices as well.
Currently net long 30.1k, up 18.3k.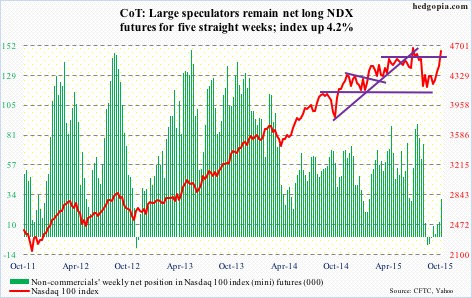
Russell 2000 mini-index: On the Russell 2000, 1210-ish has proven to be an important price point going back to March last year. That level was lost during the August sell-off, followed by an unsuccessful back test in the middle of September. Since then, it has not even come close to retesting that resistance. It is struggling at a lower level – 1170-ish. On IWM, the iShares Russell 2000 ETF, this corresponds to $116; on Friday, it closed right underneath.
Small-caps have been lagging large-caps for a while now, including since the August lows. The Russell 2000 continues to hug its 50-day moving average, and is four-plus-percent away from its 200-day moving average. In contrast, the S&P 500, the Nasdaq composite as well as the Dow Industrials recaptured their respective 200-DMA on Friday.
Currently net short 34.5k, down 5.9k.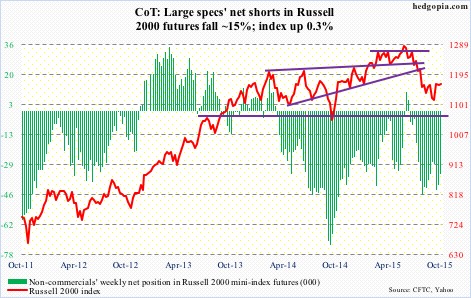
US Dollar Index: Post-Draghi comments on Thursday, euro’s loss was dollar’s gain. The US dollar index, which assigns 57.6-percent weighting to the euro, surged 1.5 percent in that session. With the Thursday move, in one swoop, the index recaptured 50- and 200-day moving averages. It rallied further on Friday, and is now just under the daily upper Bollinger band.
Non-commercials continued to reduce net longs, but this was prior to the Thursday-Friday move in the dollar index, which has broken out. Let us see if these traders will join the bandwagon.
Currently net long 28.2k, down 10.7k.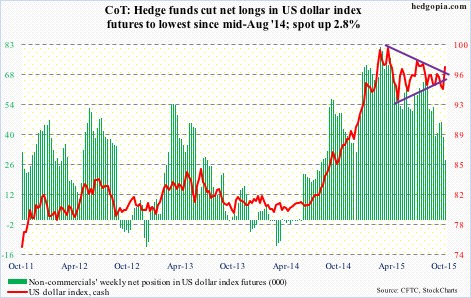
VIX: Spot VIX gave back another 3.9 percent during the week, but this was the first time in four weeks it managed to close off the lows, dropping to a 13 handle on Friday before rebounding.
The spot remains way oversold on a daily basis, and needs to clear the 200-day moving average (16.56) before a genuine rally attempt could be launched.
Currently net long 7k, down 8.6k.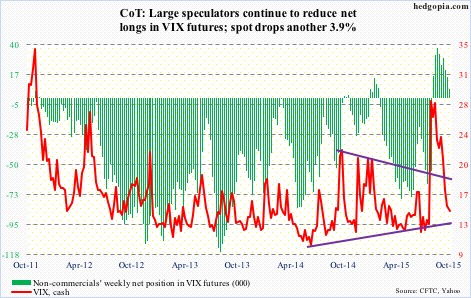
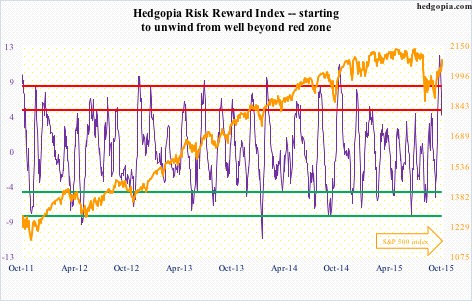
Hedgopia Risk Reward Index