The following are futures positions of non-commercials as of November 10, 2015. Change is week-over-week. (Due to Veterans Day, a Federal holiday, last week, the CFTC released numbers on Monday.)
10-year note: “Muted global economic growth will not support a significant reduction in government debt or allow central banks to raise interest rates markedly.”
The above quote is from a Moody’s report last week stating that the world economy’s ability to fight shocks is dented, and that the hoped-for growth in both developed and emerging markets has not materialized.
As if to vouch for Moody’s rather gloomy outlook, the OECD cut its forecasts for global growth to 2.9 percent for this year, but continues to be optimistic beyond 2015. Next year, it expects 3.3 percent growth and 3.6 percent in 2017. In September, 2015 was expected to show growth of three percent, and in June this was 3.1 percent. The 2016 forecast runs a risk of downward revision.
This also applies to the U.S. Real GDP grew 2.4 percent in 2014. This year, the economy is forecast to grow 2.2 percent. Next year? The consensus expects growth of 2.6 percent.
In this scenario – if it comes to pass, that is – the Fed would have trouble defending the need to keep the Fed Funds anchored at zero.
Last week, Bill Dudley, president of the New York Fed and otherwise a dovish voice within the FOMC, talked about the need to get off the zero bound.
With all this, markets will be awfully disappointed if the Fed does not move in December. That is, unless stocks retreat substantially between now and then, and/or the November jobs report is a disappointment.
Non-commercials are a confused bunch. Last week, they raised net shorts to the highest since early May. This week, they cut back significantly.
Currently net short 36.9k, down 127.3k.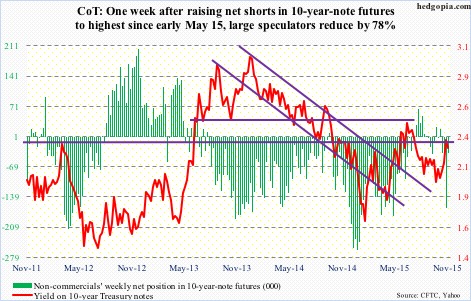
30-year bond: This week’s major economic releases are as follows.
On Tuesday, four different reports are published: the consumer price index (October), industrial production (October), the NAHB housing market index (November), and the Treasury International Capital (September).
In September, consumer prices fell the most in eight months – down 0.2 percent. In August, they fell 0.1 percent. In the 12 months through September, the CPI was unchanged after rising 0.2 percent in August. Core CPI rose 0.2 percent, after rising 0.1 percent in August. Core CPI, however, jumper 1.9 percent in the 12 months through September – the largest increase since July 2014.
In September, capacity utilization was 77.5 percent, down from the cycle high of 79 percent in November last year. Year-over-year, utilization has dropped for five straight months, and in 11 of the last 14 months month-over-month.
Builder sentiment is elevated. The NAHB/Wells Fargo housing market index was 64 in October – a 10-year high.
Despite all the hand-wringing and fear over if post-yuan devaluation China would start liquidating its holdings of Treasury securities, that is yet to happen. By August, China held $1.27 trillion in Treasury securities. The devaluation took place on August 11th. If China sold these securities, this should begin to get reflected in September data.
On Wednesday, we get housing starts for October. At a seasonally adjusted annual rate of 1.206 million, September was essentially in line with 1.211 million in June, which was the highest since 1.26 million in October 2007. Momentum has been building of late. Builders are putting their money where their mouth is.
Also on Wednesday, minutes for the October 27th-28th FOMC meeting are published.
Four FOMC members are scheduled to speak on weekdays.
Currently net short 16.7k, down 5.2k.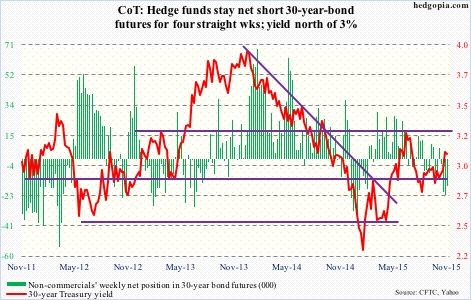
Crude oil: For the week ended November 6th, U.S. gasoline stocks fell 2.1 million barrels, to 213.2 million barrels – a 12-week low. As well, refinery utilization continued to inch up, rising 0.8 percentage point, to 89.5 percent. It has now risen 3.5 percentage points since October 9th. Utilization peaked at 96.1 percent in the August 7th week. All positives! The rest of the data was anything but…
Distillate stocks rose 352,000 barrels, to 141.1 million barrels. The prior period was at a 17-week low…Crude production rose by 25,000 barrels per day, to 9.19 million barrels per day – a 10-week high. Production peaked at 9.61 mbpd in the June 5th week. Rig counts have plunged in recent weeks/months, but has not impacted production much…Crude imports rose 434,000 barrels per day, to 7.38 mbpd…The final nail in the coffin came from crude stocks, which jumped 4.2 million barrels, to 487 million barrels. This was the seventh straight weekly increase, and stocks were at the highest since the April 24th week.
Spot West Texas Intermediate crude collapsed nearly nine percent last week.
To rub salt in the wound, the International Energy Agency said Tuesday its core expectation is for oil prices to return to $80/barrel by 2020, but the odds of it remaining stuck between $50 and $60 well into the 2020s cannot be ruled out.
The next OPEC meeting is on December 4th. Last November, the cartel decided against production cuts. Despite calls from countries like Venezuela and Algeria to cut production, odds are the Saudi Arabia-dominated group will maintain the status quo.
Put all this together, and the fact that spot WTI was once again rejected at the $48 level last week, it is not hard to fathom why oil bulls are leaving. With this, it has now lost two-plus-month support at $43. On a weekly basis there is room for downward pressure still, but daily conditions are oversold – a good opportunity for bulls to put their foot down.
Currently net long 248.9k, down 14.2k.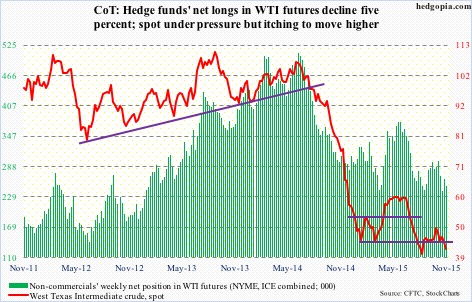
E-mini S&P 500: As elevated as short interest is, it almost feels like equity bulls have been unable to cash in on the squeeze opportunity to the fullest possible extent.
Not that shorts did not get squeezed. They did. During the September 30th-October 15th period, SPY, the SPDR S&P 500 ETF, for instance, rallied 5.6 percent, even as short interest dropped 10.6 percent. In the October 15th-October 30th period, the ETF only rose 2.8 percent, while short interest declined 15.8 percent.
The possible culprit for the lackluster rally in the second period? Lackluster inflows. The rally since the September 29th low was driven less by fresh money willing to get in on the action, and more by short-covering.
Since the week ended September 30th through this Wednesday, cumulative inflows into U.S.-based equity funds have totaled $11 billion (courtesy of Lipper). That’s it! The S&P 500 index rallied 13 percent between the September 29th low and the November 3rd high. And this was not enough to tempt new money into action.
That said, non-commercials have built sizable net shorts, and have been cutting back. This has helped stocks.
Currently net short 127.8k, down 29.8k.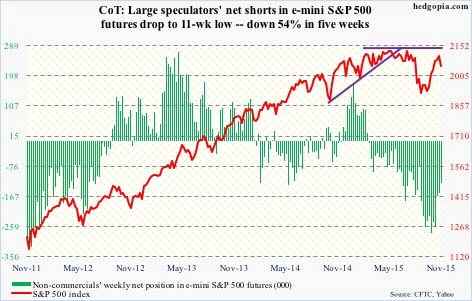
Euro: Eurozone industrial production fell by 0.3 percent in September from August – yet another data point pointing to subdued economic activity in the region.
No wonder Mario Draghi, ECB president, continues to talk dovish… most of the time anyway.
Speaking to the European Parliament last Thursday, he said inflation dynamics had somewhat weakened and that a sustained normalization of inflation could take longer to achieve than thought, hinting that additional stimulus could be announced in December.
He expressed similar sentiment at a press conference in October (after the conclusion of the governing council meeting). Also on Thursday, ECB executive board member Benoit Coeure said the debate on more stimulus in December was still open.
That said, between October 14th and November 10th, the euro lost seven percent. The currency is acting as if the announcement of additional stimulus in December is a sealed deal. Watch out if Mr. Draghi disappoints. Or for that matter, a ‘buy the news, sell the rumor’ phenomenon can materialize. The euro remains oversold on both a daily and weekly basis.
Currently net short 142.9k, up 8.6k.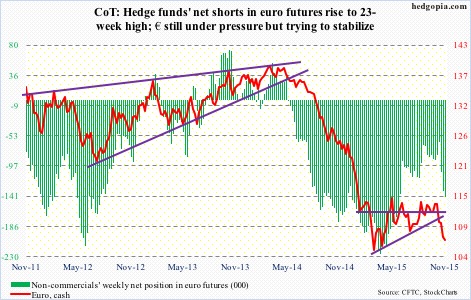
Gold: Spot gold has now been down for four consecutive weeks.
The metal tried to unsuccessfully take out resistance at 1,180 for three straight weeks, before the bottom fell out of it. In the process, it also lost support at 1,140, and is now testing the July 2015 low of 1,072.30.
So far, so good. That July low is holding, with some signs of exhaustion. Daily technicals are grossly oversold, with weeklies not too far away. Odds favor that low holds – if nothing else, for a decent bounce. For at least the next several sessions, the spot needs to go sideways for its own good.
Currently net long 68.4k, down 48k.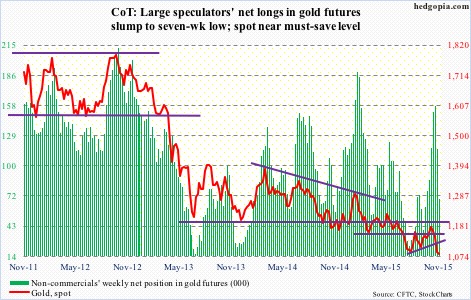
Nasdaq 100 index (mini): Back in July this year, the Nasdaq 100 broke out of resistance at 4560, only to lose it in the next few weeks. Soon followed that harrowing drop in August. Subsequent to the August-September lows, the Index once again broke out of that resistance in October, in the process also notching a new all-time high last week. And once again, the index is at risk of not being able to save the breakout. Monday, it closed right underneath that level.
Non-commercials have done a good job of being on the right side of the current rally, and continue to add.
Currently net long 81.6k, up 11.4k.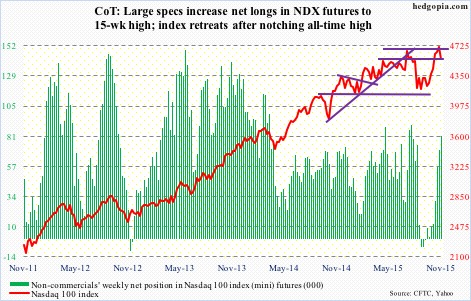
Russell 2000 mini-index: If we believe that the Fed is all ready to hike in December and that it wants to do so not because it wants to fill its monetary quiver with arrows but because it expects the economy to improve, small-caps are not buying it.
By nature, small-caps are domestically-focused, and should do better than multinationals, who might suffer if the dollar continues to strengthen because of positive interest-rate differential.
But the Russell 2000 just does not act well.
First of all, large-caps led both small- and mid-caps during the most recent rally. So when the Russell 2000 broke out of 1170 early this month, it was treated as confirmation that small-caps were finally participating. But the index was never able to take out larger resistance at 1210-1215. And now it has lost 1170. Yet another false breakout!
Currently net short 42.9k, up 1.3k.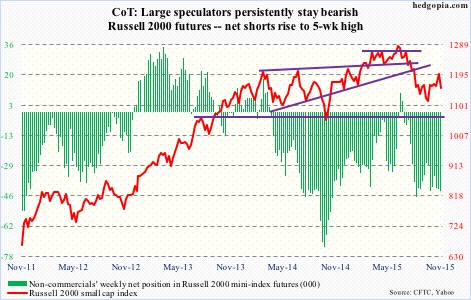
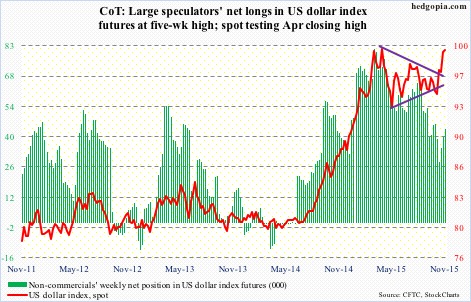
US Dollar Index: After five-plus-percent move the past four weeks, the US dollar index was essentially flat last week.
It is grossly overbought, but still has momentum. If it comes under pressure, the level to watch is 98, give and take.
Non-commercials have been adding to net longs of late, but do not look as enthusiastic as they were when the dollar index was trading at a similar level back in April.
Currently net long 43.8k, up 3.9k.
VIX: The MACD crossover in the week before proved to be prescient. The spot rallied five-plus points last week.
That said, daily conditions are now overbought, although a weekly chart has plenty of oversold conditions left to be unwound.
The action on Monday should encourage equity bulls.
Currently net short 9.5k, up 5.8k.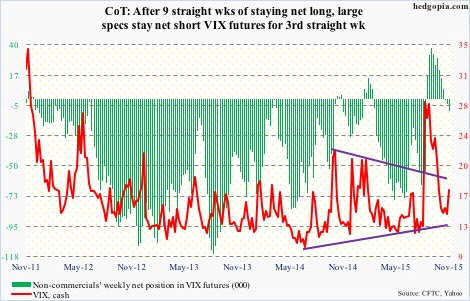
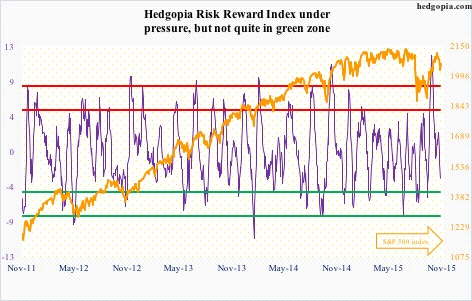
Hedgopia Risk Reward Index