The following are futures positions of non-commercials as of December 15, 2015. Change is week-over-week.
10-year note: Call it ‘dovish’ or ‘hawkish’, the Fed finally followed through on its first hike in nine years. The fed funds rate stayed zero-bound for seven long years.
While both through the post-FOMC statement and Chair Janet Yellen’s post-FOMC press conference, the message was that the pace would be gradual, markets and the Fed are on different wavelengths on this.
The dot plot indicates four more rate hikes next year. In the futures market, however, traders currently expect two hikes in 2016.
From November’s sub-50 ISM manufacturing index to sub-80 capacity utilization to widening credit spreads, economic data argue for a shallow tightening cycle. But it is also a Fed whose tool box is empty, and is in need of adding arrows to its monetary quiver before the next downturn hits.
If the markets let it, that is.
The Ben Bernanke-led Fed sang the virtues of the wealth effect. Ms. Yellen’s Fed is probably no different. Come 2016, if the dot plot continues to maintain the current projected pace, stocks will probably begin to throw a tantrum, forcing FOMC members to change their tune.
Currently net short 11.4k, down 13.1k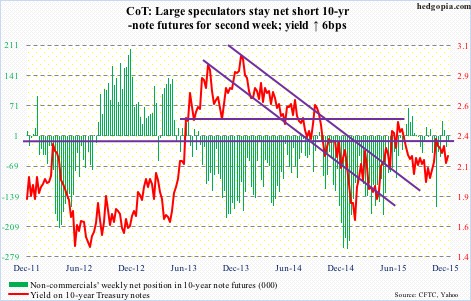
30-year bond: This week’s major economic releases are as follows. Happy Holidays!
On Tuesday, we get GDP (3Q15 final reading), corporate profits (3Q15 revised estimates), as well as existing home sales (November).
The second estimate put GDP growth at 2.1 percent, down from 3.9 percent in the second quarter.
Corporate profits with inventory valuation and capital consumption adjustments for the third quarter came in at a seasonally adjusted rate of $2.06 trillion (preliminary numbers). A year ago, they peaked at $2.16 trillion.
Existing home sales dropped 3.4 percent month-over-month in October to a seasonally adjusted annual rate of 5.36 million units. July sales of 5.58 million were the highest since 5.79 million in February 2007. Likewise, after reaching a nine-year high 112.3 in May, the pending home sales index has dropped to 107.7 in October. The latter tends to lead sales.
Wednesday, we get durable goods orders (advance report for November), personal income (November), new home sales (November), and the University of Michigan’s consumer sentiment (final December reading).
Orders for non-defense capital good ex-aircraft – proxy for business capital expenditures – peaked at $74 billion in September last year, and rose 0.4 percent year-over-year in October, to $70 billion. This was the first y/y increase in nine months.
In the personal income report, all eyes will be fixated on core personal consumption expenditures, which grew at 1.3 percent annually in October. The last time it grew at two percent was in April 2012. Core PCE is the Fed’s favorite inflation gauge.
New home sales jumped 10.7 percent in October after dropping 12.9 percent in September. It is a volatile series. The 12-month rolling average was 495,000 units in October (SAAR) – the highest since 502,000 in November 2008.
The preliminary reading of consumer sentiment was 91.8. January’s 98.1 was the highest since 103.8 in January 2004.
Currently net short 5.8k, down 15.1k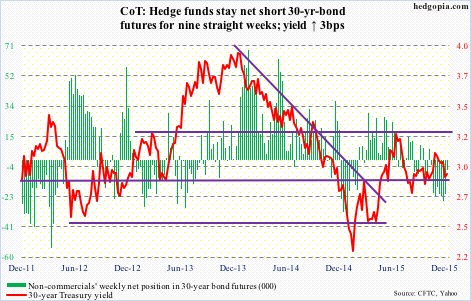
Crude oil: The EIA report for the week ended December 11th was an out-and-out disappointment.
Crude stocks jumped 4.8 million barrels, to 490.7 million barrels – a hair’s breadth away from the all-time high of 490.9 million barrels in the April 24th week.
Gasoline stocks rose by 1.7 million barrels, to 219.4 million barrels – an eight-week high.
Distillate stocks increased 2.6 million barrels, to 152 million barrels – a 13-week high.
Production increased by 12,000 barrels per day, to 9.18 million barrels per day. Production peaked at 9.61 mbpd in the June 5th week.
Crude imports rose by 291,000 barrels per day, to 8.31 mbpd. This was the highest since 8.36 mbpd in the September 27, 2013 week.
Refinery utilization dropped 1.2 percentage points, to 91.9 percent. This was the second consecutive weekly drop. Utilization peaked at 96.1 percent in the August 7th week.
Spot West Texas Intermediate crude dropped below $35 before bouncing, rising 1.3 percent in the week.
OPEC secretary general expects oil output to decline in the next two to three years as this year alone $130 billion in investment is planned to be cut due to low prices; non-OPEC supplies are set to decline by about 400,000 barrels per day next year.
Further, for the first time in 40 years, U.S. crude ban was lifted. That said, the WTI-Brent differential is less than $1/barrel. (Brent dropped 3.9 percent in the week.) In 2011, the spread was nearly $28. Energy Aspects argues that WTI needs to be $4 cheaper for exports to work.
Ah, well!
Non-commercials have been reducing net longs for a while now… last week was at nearly a three-year low.
On a weekly chart, the week produced a doji. Let us see if oil bulls can build on it.
Currently net long 216.3k, down 9k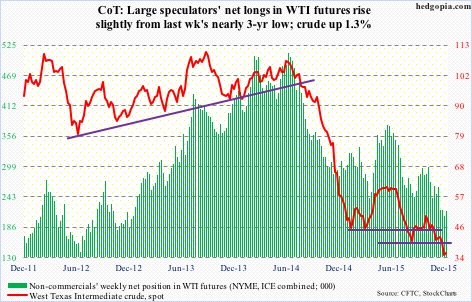
E-mini S&P 500: For the week ended Wednesday, $13.2 billion left U.S.-based equity funds (courtesy of Lipper). This follows withdrawal of $8.6 billion in the prior week.
On September 29th, the S&P 500 index successfully tested August lows, before getting on a powerful rally. Flows, however, failed to cooperate. Secondly, the index has been going sideways/down the past five weeks, and money is beginning to come out, as can be noticed particularly the past couple of weeks. Since September 30th, $11 billion has now left these funds.
In the meantime, foreigners continue to shun U.S. equities. In October, the 12-month running total of net foreign purchases of U.S. equities was minus $84.9 billion. The last time this metric was positive was two years ago.
Bulls have seasonal tailwind at their back, but if flows continue to behave this way, it is only a matter of time before stocks run into a headwind.
From bulls’ perspective, the good thing is that on Monday buyers showed up near 1990 – must-hold support. Resistance at the 50- and 200-day moving averages, which have now converged at 2062, proved too strong. The 1990 support is once again in play.
Non-commercials continue to cut back net shorts – now at a 28-week low.
Currently net short 75.3k, down 5.5k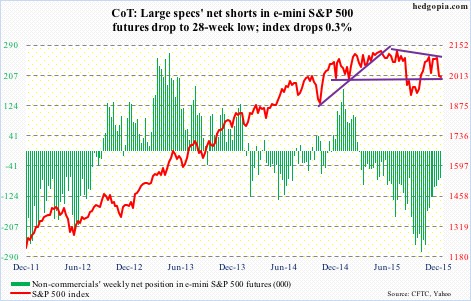
Euro: Markit’s Eurozone manufacturing PMI in December rose to 53.1 – a 20-month high, services fell to 53.9 from 54.2. The composite slipped to 54 from November’s 54.2.
Despite massive depreciation of the euro, growth continues to remain subdued.
Between the May 2014 high and the March 2015 low, the euro collapsed 25 percent. That low was successfully tested last month. The subsequent rally saw it gain nearly five percent in eight sessions, before facing massive resistance at its 200-day moving average. Come Thursday, an intra-day rally attempt got repelled at its 50-day moving average.
The path of least resistance near-term? Probably down.
Non-commercials slightly cut back, but continue to remain heavily net short.
Currently net short 160k, down 12.4k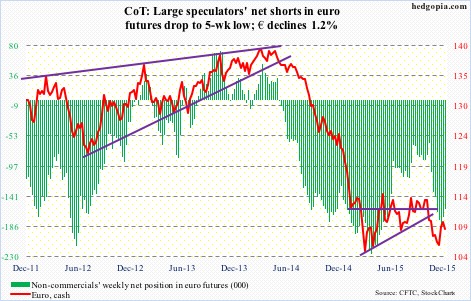
Gold: The rate hike this week was one of the most well-telegraphed and well-anticipated Fed moves. The day of the hike, spot gold managed to rally 1.1 percent. Come Thursday, it gave it all back and then some – down two percent – thanks to strength in the greenback.
Earlier in the prior several sessions, the metal’s rally attempt stopped at support-turned-resistance at $1,070-$1,080.
The spot remains oversold on a daily basis, and is right underneath the afore-mentioned resistance.
Two weeks ago, non-commercials had the least net longs since October 2002, and have not added much since.
Currently net long 13.7k, down 6k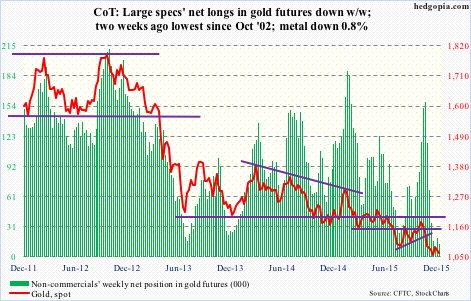
Nasdaq 100 index (mini): On Monday, the index found support at its 200-day moving average, followed by a Thursday close right on its 50-day moving average. Friday, it lost that average.
Apple (AAPL), which makes up nearly 13 percent of the index, does not act well. It has broken its June 2013 trend line, and is meeting with resistance at the underside of that broken support. Also, there is potentially a head-and-shoulders pattern forming on a weekly chart, with the neckline break occurring around $105 – worth watching.
Beginning April this year, the 4560 level on the index has been a line in the sand of sorts. This has once again been lost. The 200-DMA is probably once again in play.
Currently net long 61.5k, up 7.5k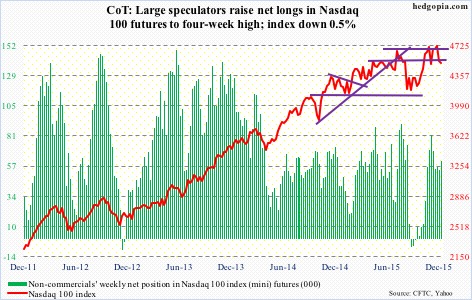
Russell 2000 mini-index: The 200-day moving average is now pointing lower, with the 50-day flat to slightly lower.
Things would probably look a whole lot different if early this month the index succeeded in taking out the 200-DMA, which at the time also approximated the 1210-1215 resistance in place since March 2014.
It has been a while investors have not fancied small-caps. At this stage in the cycle, it is hard to imagine them putting on their risk-on hat. In this scenario, the medium- to long-term outlook looks bleak.
That said, near-term is another matter. Daily conditions are oversold. Curiously, a reverse head-and-shoulders pattern seems to be developing on a daily chart. The neckline lies at that afore-mentioned 1210-1215 resistance… hard to imagine a breakout.
As things stand, the best that could happen is unwinding of daily overbought conditions.
That said, non-commercials do not agree, having raised net shorts to a 10-month high.
Currently net short 49.2k, up 16.7k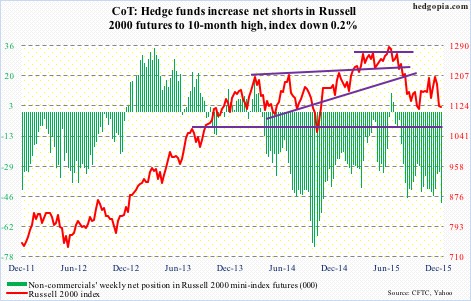
US Dollar Index: Responding to the Bank of Japan’s surprise easing move on Friday morning, the dollar took a wild ride. Immediately after the BoJ announcement, the greenback rallied, but then the markets decided the unexpected easing did not go far enough, pushing up the yen.
The BoJ left the overall target of annual asset purchases unchanged at around ¥80 trillion, but said it will lengthen the average maturity of the Japanese government bonds it purchases to seven to 12 years from seven to 10 years. Plus, it will buy another ¥300 billion of exchange-traded equity funds, which will be in addition to the ¥3 trillion in ETFs it has purchased annually since late 2014. Desperate!
Despite the reaction post-BoJ decision, the dollar index can go either way near-term. Medium- to long-term, for it to break out of March and November (this year) highs, the fed funds rate probably needs to go up at least a point next year – not likely.
Interestingly, in a week in which the Fed was all but certain to raise rates, non-commercials reduced net longs by 28 percent.
Currently net long 36.9k, down 14.1k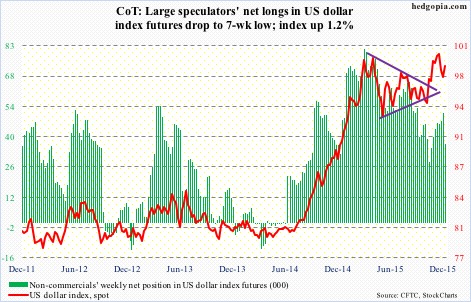
VIX: Last week, spot VIX surged past 50- and 200-day moving averages as well as horizontal resistance at 16 and 21-22. Come Monday, it spiked another 10 percent, before reversing.
More often than not, a spike reversal is followed by continued pressure on the spot. That was the case until Thursday when volatility buyers stepped up to defend 16.
The spot has once again reclaimed the afore-mentioned averages.
That said, VIX is not done unwinding daily overbought conditions. Friday, it was not able to hold on to gains, even as stocks in general closed near session lows.
In the meantime, the VIX to VXV ratio, at 0.97, is beginning to drop from overbought zone. Last Friday, the ratio spiked to unity.
The probable path of least resistance near-term? Down.
Currently net short 7.4k, down 2.7k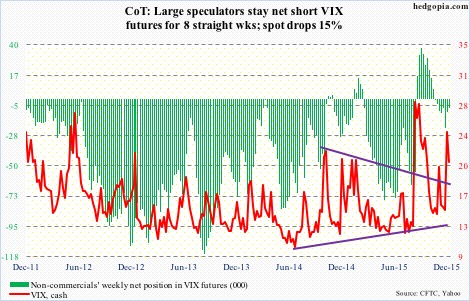
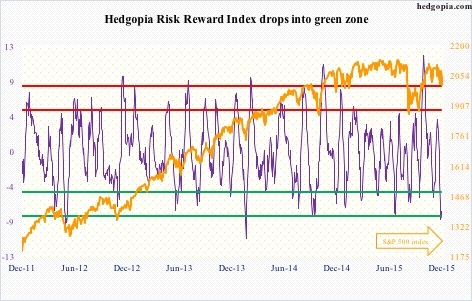
Hedgopia Risk Reward Index