The following are futures positions of non-commercials as of December 22, 2015. Change is week-over-week. (Due to Christmas last week, the CFTC released numbers on Monday, instead of last Friday.)
10-year note: The Chicago Fed’s National Financial Conditions Index (NFCI) has been tightening – from -0.92 in June last year to the latest -0.57. This is the tightest since November 2012. When the index rises, it indicates deteriorating financial conditions. Huh!
The Fed just raised the funds rate by 25 basis points, to 0.37 percent, after pinning it on the floor for seven long years. So what exactly is the NFCI trying to tell us? That the Fed’s zero interest-rate policy is no longer providing a tailwind?
That said, we are yet to hear of financial firms being in trouble. Or, for that matter, people not making margin calls.
Nevertheless, the steady rise in NFCI is coming in the midst of a Fed that is looking toward four more quarter-point hikes next year. Markets expect two. Odds favor the latter wins.
Here is a scenario in which the Fed may indeed end up going for four.
The budget deal passed this month by Congress allows for extension of tax breaks, increase in military spending, and expansion of government programs. The Wall Street Journal expects the bill to add $800 billion in new deficits in the current fiscal year. And Strategas Partners believes this could add as much as 0.7 percent to GDP in 2016.
The long end of the yield curve does not buy into this scenario.
That said, non-commercials have stayed net short the past three weeks.
Currently net short 12.2k, up 767.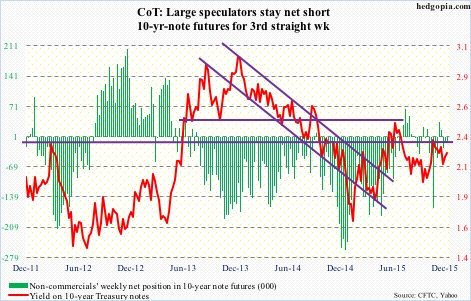
30-year bond: Happy New Year! It is a holiday-shortened week, and major economic releases are as follows.
Later this morning, the S&P/Case-Shiller home price index is reported for October. Home prices are still rising but the pace is decelerating. In September, price rose 4.9 percent nationally – faster than 4.3 percent in February this year but substantially weaker than the 10.9-percent pace in October 2013.
November’s pending home sales index is published on Wednesday. In October, it rose two-tenths of a point to 107.7, but remains nearly five points below the May 2015 high of 112.3. As the index has weakened, existing home sales have followed. Sales collapsed 10.5 percent in November, to a seasonally adjusted annual rate of 4.76 million unis. Earlier, they peaked in July this year at 5.58 million – the highest since 5.79 million in February 2007.
Currently net short 7.5k, up 1.7k.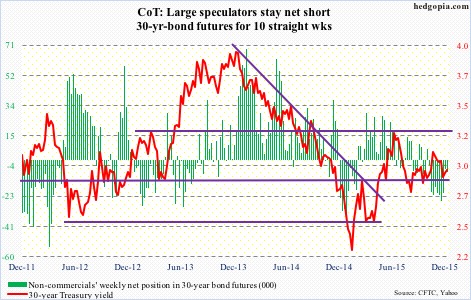
Crude oil: On Tuesday through Thursday last week, for the first time since 2010, spot West Texas Intermediate crude settled above spot Brent. The streak continued yesterday. The former is getting bid up because of prospects of tighter supply post-lifting of a 40-year exports ban. The irony in all this is that now it is cheaper to import crude… hence anyone’s guess as to how long the spread continues to favor the WTI.
Speaking of which, in the week ended December 18th, crude imports fell by 986,000 barrels, to 7.33 million barrels – a five-week low. The prior week was the highest since 8.36 mbpd in the September 27, 2013 week.
The EIA report also showed crude stocks fell by 5.9 million barrels, to 484.8 million barrels, more than offsetting the prior week’s increase. Last week’s 490.7 million barrels was just a hair’s breadth away from the all-time high of 490.9 million barrels in the April 24th week.
Distillate stocks also fell by 661,000 barrels, to 151.3 million barrels, from last week’s 13-week high.
Production rose by three million barrels a day, to 9.18 mbpd – a three-week high. Production peaked at 9.61 mbpd in the June 5th week.
Refinery utilization fell for a third consecutive week, to 91.3 percent. Utilization peaked at 96.1 percent in the August 7th week.
Gasoline stocks rose by 1.1 million barrels, to 220.5 million barrels – a 10-week high. This was the sixth straight weekly increase.
Oil bulls were able to build last week on the prior week’s doji, as spot WTI rose 6.4 percent.
Resistance is galore, with the nearest lying at 40, and after that 43, which also approximates the 100-day moving average. The 50-day moving average lies at 41.55.
With the 3.8-percent drop yesterday, spot WTI is literally sitting on its slightly rising 10-day moving average.
Non-commercials have been reducing net longs for a while now, and continue to do so, with holdings now at a three-year low.
Currently net long 202.1k, down 14.2k.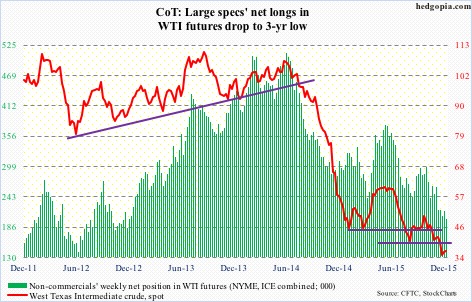
E-mini S&P 500: Outflows continued in the week ended last Wednesday. Another $7.6 billion exited U.S.-based equity funds (courtesy of Lipper). In the past three weeks, north of $29 billion came out of these funds. And since September 30th, $18.6 billion left.
This may be why shorts are beginning to press a little. Short interest on SPY, the SPDR S&P 500 ETF, went up eight percent mid-December, to 312.7 million shares. This is the highest in two months. That said, it is some 28 percent below the high three months ago.
Back then, shorts persistently built into that mid-September high, just when stocks were about to bottom out and rally. Soon followed a squeeze, with SPY short interest dropping to 278 million by the middle of November.
Viewed this way, the present level of short interest is probably not enough to set in motion another squeeze cycle. Besides, as stated earlier, flows are not cooperating.
Seasonality still favors stocks… at least that has been the case historically. But it is also a known seasonal phenomenon, with traders increasingly positioning earlier.
In the very near-term, there is room to rally. Daily overbought conditions still have room left for unwinding. Daily MACD just crossed up.
Here is the rub. With last week’s rally the S&P 500 sat right on its 50- and 200-day moving averages. Come Monday, it lost both. The consolation is that the index yesterday finished substantially off the lows.
The level to watch is 2090 on the way up and 2040 on the way down, followed by 2020 and must-hold 1990.
For the first time in nine weeks, non-commercials added to net shorts.
Currently net short 95.2k, up 19.9k.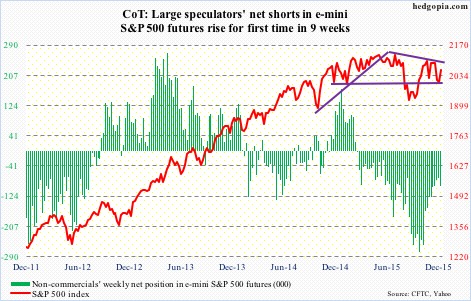
Euro: The Spanish general elections in the prior weekend splintered Madrid’s parliament. Yields shot up. So far, there is no contagion. The sell-off in Spanish bonds is contained.
The traditional two-party dominance was broken in that nation. Podemos, an anti-austerity party, is banging on doors of power, securing nearly 21 percent of seats. Is this a prelude to what is to come in Italy, France, etc.?
If it gathers momentum in months and years to come, it can have huge implications for the euro. Markets had a brief glimpse into this after Greece’s Syriza party came into power early this year, only to see it capitulate later.
For now, the euro is hanging on to the gains post-ECB disappointment on December 3rd. The rising 20-day moving average is providing support, with the currency currently trapped between 50- and 200-day moving averages.
Non-commercials slightly added, and continue to remain heavily net short.
Currently net short 161k, up 1.1k.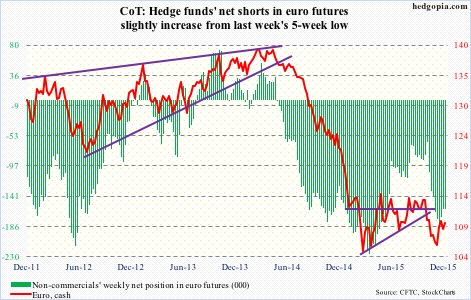
Gold: It has been more than a month since the metal lost 1,080. Since then, it dipped to 1,045, but that low has yet to be undercut.
In the meantime, shorter-term moving averages have stopped going down. A nice push higher here can improve the yellow metal’s picture – at least near-term. But it continues to struggle.
Yesterday, it closed near the afore-mentioned averages. The metal simply followed oil lower.
Non-commercials are yet to show massive enthusiasm for gold. Nevertheless, they have been adding since the multi-year low early this month. Three weeks ago, they had the least net longs since October 2002.
Currently net long 26.4k, up 12.8k.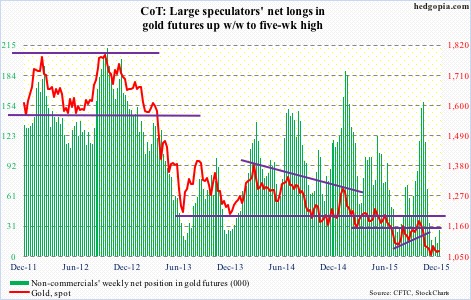
Nasdaq 100 index (mini): The 4560 level continues to act like a magnet. Having lost it in the prior week, the index recaptured the level last week.
There is room for the index to push higher near-term, but here is the thing.
Daily momentum indicators such as the RSI and stochastics have reached the median, and this is where they can turn back if momentum is weak.
Apple (AAPL), which constitutes nearly 13 percent of the index, continues to be a wild card. It remains oversold on a daily chart, but has broken its June 2013 trend line. Moreover, there is potentially a head-and-shoulders pattern forming on a weekly chart, with the neckline break occurring around $105, which was saved last week.
Non-commercials continue to cut back net longs – now at a nine-week low.
Currently net long 47.9k, down 13.6k.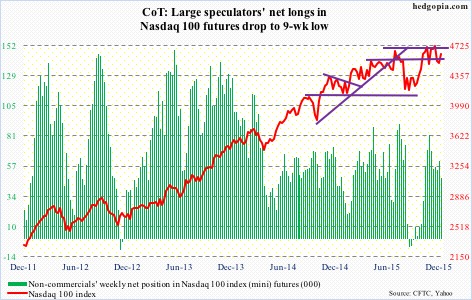
Russell 2000 mini-index: Short interest on IWM, the iShares Russell 2000 ETF, dropped 4.4 percent, to 99.7 million shares – an eight-month low. Since the end of September, it has dropped 24 percent. Between the periods, the Russell 2000 was up a mere 2.8 percent. Not much to write home about.
For a while now, investors/traders have not been showing much love for small-caps.
The 1210-1215 resistance has been in place since March 2014. Most recently, a rally attempt was repelled early this month. Before this gets tested again, small-cap bulls will have to now take out another resistance – 1170, which approximates the 50-day moving average.
The 200-day moving average is now pointing lower, with the 50-day flattish.
Non-commercials, having had bearish bias on small-caps for a while, in the prior week raised net shorts to a 10-month high.
Currently net short 47.2k, down 2k.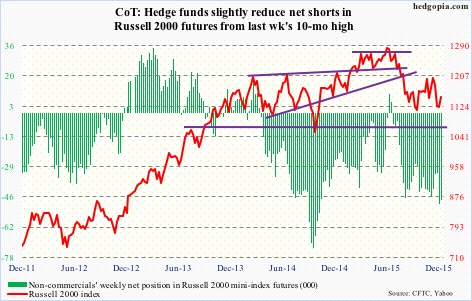
US Dollar Index: The dot plot tells us that FOMC members would wish to hike four times next year. Futures traders are pricing in only two. The dollar index is so far not buying the Fed’s hawkish message.
Back in March, the index reached a high of 100.71, before backing off. Then in November, that high was retested, as it rose to 100.60, before coming under renewed pressure.
Since the FOMC decision in the middle of the month, the dollar index is essentially unchanged, let alone take another stab at the afore-mentioned highs.
Also, non-commercials are nowhere near as net long US dollar index futures as they were back in March. In fact, in a week in which the Fed was all but certain to raise rates, non-commercials reduced net longs by 28 percent.
Last week, they cut back more, with holdings at a nine-week low.
Currently net long 33.4k, down 3.5k.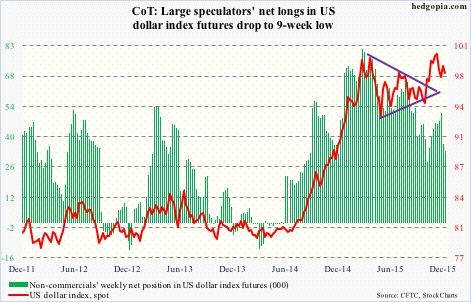
VIX: It has been a while spot VIX has vacillated around its 50- and 200-day moving averages. Having briefly dipped below 15 last Friday, it, once again, surged past both on Monday, although it was unable to close out the session near the highs.
Daily momentum indicators are oversold, and look to be itching to move higher.
In the meantime, the VIX-to-VXV ratio dropped to 0.8 last Friday – onto oversold zone – before rising to 0.86 yesterday. There is room for it to continue moving higher before it gets to overbought zone, and that could spell trouble for stocks.
Spot VIX’s probable path of least resistance near-term is up.
Currently net short 13.8k, up 6.4k.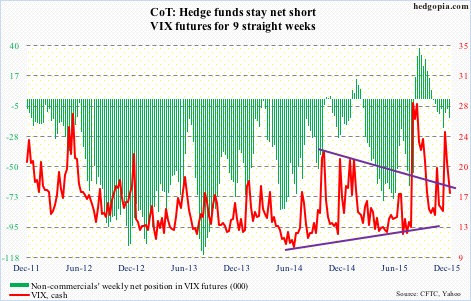
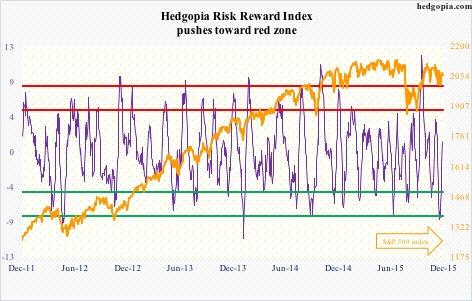
Hedgopia Risk Reward Index