The following are futures positions of non-commercials as of December 29, 2015. Change is week-over-week. (Due to New Year’s Day last week, the CFTC released numbers on Monday, instead of last Friday.)
10-year note: ‘Will it or wouldn’t it?’ was an active topic of discussion among market participants throughout 2015, particularly the second half. It being the Fed. Markets were put on edge for months before the central bank finally raised rates in December, and are once again on pins and needles regarding the path going forward.
Who will lead who? Markets or the Fed? For reference, the FOMC’s dot plot expects four quarter-point hikes this year. The futures market begs to disagree. It has only priced in two.
As things stand now, the Fed will probably end up lowering its forecast in line with markets’ subdued optimism, possibly even lower.
A lot of course will depend on how the U.S. economy fares. Of note, inventory is elevated. The economic recovery is maturing – in its seventh year. Housing could be losing momentum.
It is not difficult to come up with a scenario in which the economy looks vulnerable.
That said, with the Fed just having hiked by a quarter point, under some circumstances it makes sense to wonder when it would begin to at least stop reinvesting proceeds from maturing Treasuries and mortgage-backed securities. That would effectively amount to shrinkage of the balance sheet. On the other hand, if wheels come off the economy and with the Fed’s conventional monetary tool box empty, another iteration of unconventional QE is probably not out of the question.
What we can be absolutely sure of is this: Macro data and Fed commentary will be dissected like maybe in no other time to gauge the pace – or a lack thereof – of tightening. Good luck!
For now, non-commercials suddenly did a 360 and went net long, with holdings at a 20-week high.
Currently net long 43k, up 55.2k.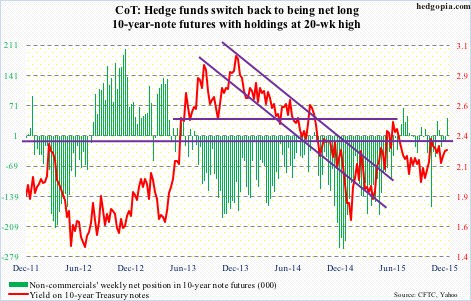
30-year bond: Major economic releases this week are as follows.
November’s ISM non-manufacturing index comes out on Wednesday. Non-manufacturing has not been faring as bad as manufacturing. Nonetheless, October saw a drop of 3.2 points, to 55.9, a six-month low. Similarly, new orders dropped 4.5 points, to 57.5 – the lowest since February.
The durable goods data for November was published on December 23rd. More detailed estimates, plus non-durable goods data, will be published on Wednesday. On a preliminary basis, orders for non-defense capital goods ex-aircraft were down 0.4 percent month-over-month in November – down year-over-year for 10 consecutive months. Orders peaked at a seasonally adjusted annual rate of $74 billion in September 2014 and had dropped to $69.3 billion by November last year.
Wednesday also brings us FOMC minutes of the December 15-16 meeting. This was obviously a meeting in which the Fed decided to hike rates in nine years. It was a unanimous decision, additional color about which would be greatly appreciated by markets, but not sure the minutes would be that forthcoming.
December’s employment report is on tap for Friday. November saw a back-to-back 200,000-plus non-farm jobs. August and September were both sub-200,000. With this, monthly payroll creation has now averaged 210,000 in 2015 – much weaker than 260,000 in 2014.
Similarly, the monthly increase in average hourly earnings of private-sector employees slowed to four cents in November, after a rise of nine cents in October. Year-over-year growth decelerated to 2.3 percent from 2.5 percent in October, which was the highest since July 2009. The last time earnings grew with a three handle was April 2009.
Currently net short 11, down 7.4k.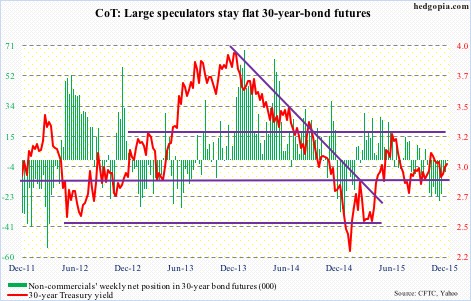
Crude oil: The EIA report for the week of December 25th contained several negatives.
Crude imports rose by 566,000 barrels a day, to 7.89 million barrels per day. Two weeks ago, imports of 8.31 mbpd were the highest since 8.36 mbpd in the September 27, 2013 week.
Production rose by 23,000 mbpd, to 9.2 mbpd – a four-week high. Production peaked at 9.61 mbpd in the June 5th week.
Stocks were all up, with crude inventory rising 2.6 million barrels, to 487.4 million barrels. The 490.7 million barrels two weeks ago was just a hair’s breadth away from the all-time high of 490.9 million barrels in the April 24th week.
Gasoline stocks rose by 925,000 barrels, to 221.4 million barrels – a 12-week high. This was the seventh straight weekly increase.
Distillate stocks rose by 1.8 million barrels, to 153.1 million barrels – a 15-week high.
The only positive was the increase in refinery utilization to 92.6 percent from 91.3 percent in the prior week – a three-week high. Utilization peaked at 96.1 percent in the August 7th week.
The new variable in the oil equation is growing tension between Iran and Saudi Arabia. In normal circumstances, this should have helped. In fact, that is precisely how things unfolded yesterday, but initial strength was sold into. Spot WTI moved from a 3.6-percent gain to a two-percent loss in a matter of an hour, closing out the session down 0.5 percent.
Non-commercials have been reducing net longs for a while now, with holdings at a three-year low in the prior week. This week, they added some.
Currently net long 207.5k, up 5.4k.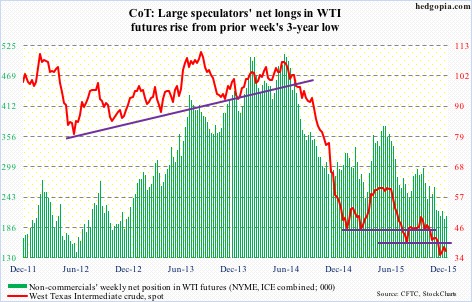
E-mini S&P 500: For the first time in five weeks, U.S.-based equity funds attracted inflows in the week ended last Wednesday, amounting to $10 billion (courtesy of Lipper). This was after $30.3 billion left these funds in the prior four weeks.
With this, a total of $8.6 billion has been withdrawn since September 30th. This is a good reference point as stocks in general, including the S&P 500 index, bottomed on the 29th of that month.
The lack of flows was evident in how December performed. It was the first back-to-back down Decembers since 1981/’82. A record!
After three years of double-digit gains, the S&P 500 dropped 0.7 percent in 2015. Another record! For the first time in 145 years, a year ending in 5 ended up in the red column. The last time this happened was in 1875 – down 3.7 percent (courtesy of @RyanDetrick, a must-follow). The year 1895 came close – up a mere 0.5 percent.
As a matter of fact, 2015 could have very much ended up like 1895. By December 30th, 2015 was up 0.22 percent. The next session – the year’s last –was a volatile session. Down, up and then down on a five-minute chart. At one point during the session – shortly after noon – the S&P 500 was up 0.18 percent for the year. Then gradually it gave up the gains, and then some.
Enough looking through the rearview mirror. On to the windshield.
Once again, @RyanDetrick points out that the S&P 500 has not been down the first day of the year three straight years since 1999-2001. The index was lower the past two years – down 0.89 percent and 0.03 percent, respectively. Yesterday, stocks were taken to the woodshed, with the S&P 500 down 1.5 percent.
The index has been trapped within a descending channel for a couple of months now. The upper end of the channel lies at 2090, which was not even tested last week, although it came close. With the drop yesterday, support at both 2040 and 2020 has been lost.
If there is any consolation in yesterday’s price action, it is that 1990, a must-hold, was tested and held. This is where the low end of that channel lies as well. Remains to be seen if bulls can build on this. They seem to be swimming upstream.
Currently net short 97.2k, up 1.9k.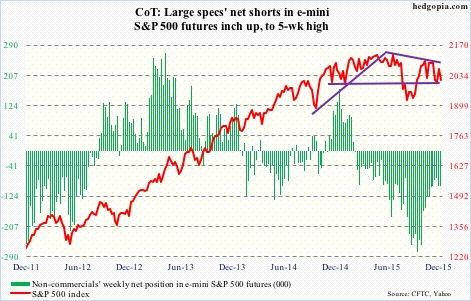
Euro: Weekly momentum indicators that were in the process of unwinding oversold conditions are beginning to weaken before even reaching the median.
The currency rallied hard on December 3rd, responding to the ECB’s decision that was perceived as a disappointment. That momentum did not last long, as the 200-day moving average came in the way.
Last Thursday, the euro literally closed on its 50-day moving average, which it lost yesterday, albeit ever so slightly. The currency is below shorter-term moving averages, and there is now a bearish daily MACD crossover.
Non-commercials slightly reduced net shorts, but continue to lean heavily bearish.
Currently net short 160.6k, down 497.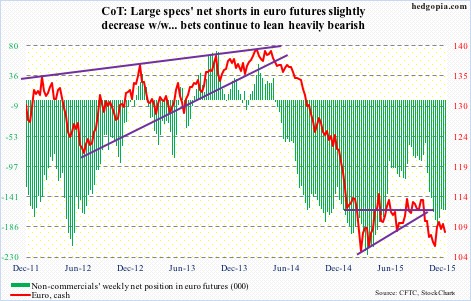
Gold: Spot gold posted third straight year of losses, and ended 2015 with mixed signals. Sort of.
The metal lost support at $1,080/ounce in the middle of November, and has more or less gone sideways since. Early last week, it looked like a 10/20 crossover (daily average) was in the making… which is still the case, and should help the metal should it complete.
In the past month and a half, gold bugs have tried several times to take out the 1,080 resistance – unsuccessfully – including yesterday.
After having substantially cut back net longs, non-commercials are yet to show the kind of love they did even two months ago. Holdings continue to hover near multi-year lows.
Currently net long 19.1k, down 7.3k.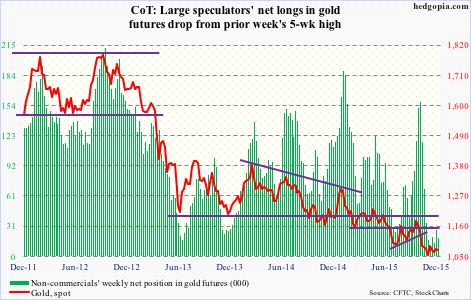
Nasdaq 100 index (mini): Tech-heavy indices fared well last year, with the Nasdaq 100 up 8.4 percent and the Nasdaq composite up 5.7 percent. In contrast, the S&P 500 fell 0.7 percent and the Dow Industrials lost 2.2 percent.
The tech outperformance is laudable until we consider this. The so-called FANG propelled these indices. Facebook (FB) rallied 34.2 percent, Amazon (AMZN) 117.8 percent, Netflix (NFLX) 134.4 percent, and Alphabet (GOOGL, formerly Google) 46.6 percent.
In the Nasdaq 100, these four names are respectively weighted 4.3 percent, 5.5 percent, 0.9 percent, and 4.6 percent. At 12.9 percent, the largest weight goes to Apple (AAPL), which lost three percent last year. Technically, it has broken its June 2013 trend line. And, there is potentially a head-and-shoulders pattern forming on a weekly chart, with the neckline break occurring around $105, where it sat on Thursday and was broken intra-day yesterday, but was salvaged by close. AAPL remains grossly oversold on a daily basis, let us see if bulls can take advantage of this as well as yesterday’s reversal.
Further, it is hard to imagine the FANG names – particularly AMZN and NFLX – repeat their performance this year. Can energy – last year’s laggards – provide the leadership? XLE, the SPDR Energy ETF, lost 21.5 percent in 2015. Even if it does, it does not help the Nasdaq 100 much.
For some time now, 4560 has proven to be an important price point, and was lost yesterday; the index did, however, manage to save the 200-day moving average.
Currently net long 60.9k, up 13k.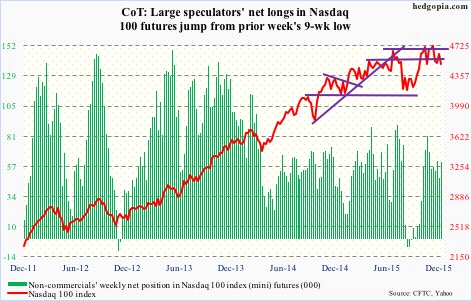
Russell 2000 mini-index: If we are indeed in a sustained tightening cycle in the U.S., then small-caps will probably continue to lag large-caps. In 2015, the Russell 2000 index lost 5.7 percent, lagging large-caps big time.
If small-caps were any indication, investors were not in risk-on mode last year. This is the same as high-yielding stocks lagging dividend growth stocks, or, for that matter, debt-heavy stocks over cash-rich.
How about 2016?
Well, the year has not gotten off to a good start, and 2015 did not end well.
Early last month, the 1210-1215 resistance, which has been in place since March 2014, held firm, with the index subsequently also losing 1170.
The 200-day moving average is decidedly pointing lower, with the 50-day flat to slightly down.
The index is now down 14-plus percent from the July 2015 high.
Kudos to non-commercials for having nailed this. Net shorts are at a 10-month high.
Currently net short 49.6k, up 2.4k.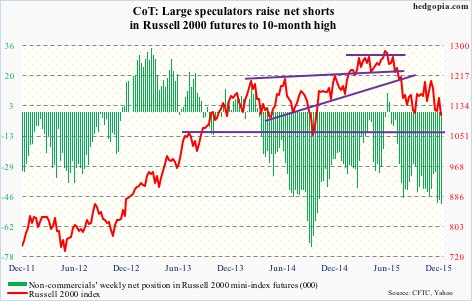
US Dollar Index: Gained nine percent in 2015, its third straight year of gains.
At least going by non-commercials’ holdings, it is tough to argue the streak continuing in 2016.
Back in March last year, the dollar index reached a high of 100.71, before coming under pressure. Then in November, it tested that high by rallying to 100.60. Non-commercials were net long a lot more contracts in March than they were in November. That is not a vote of confidence from these traders.
In the prior week, they cut back net longs to a nine-week low.
Currently net long 33.6k, up 208.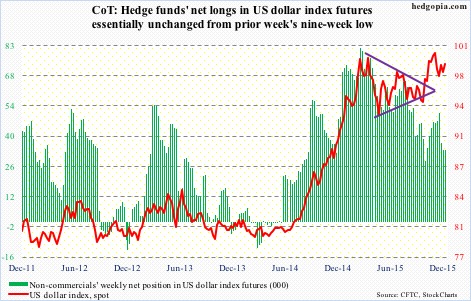
VIX: In the prior week, spot VIX was acting like it wanted to rally. That it has… continued to do so yesterday.
As recently as the middle of December, the spot shot up to just under 27, before reversing. No such spike-reversal signal just yet. That said, it was unable to hang on to the gains yesterday, as it got slammed in the last half hour. Worth watching for a spike that gets sold.
Currently net short 8.4k, down 5.4k.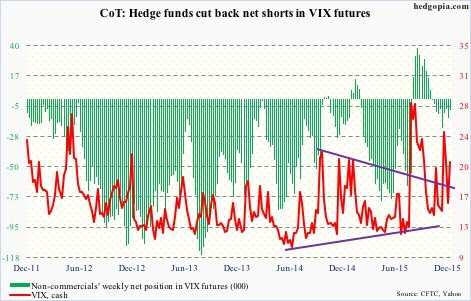
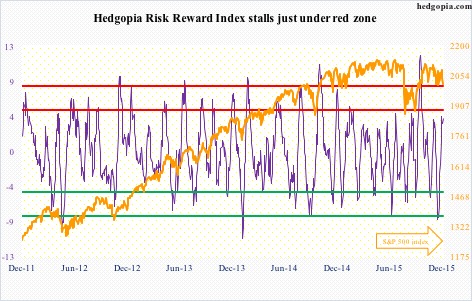
Hedgopia Risk Reward Index