The following are futures positions of non-commercials as of January 19, 2016. Change is week-over-week.
10-year note: The International Monetary Fund lowers – again – its outlook for global economic growth this year. Warning of bumpier rides, especially in the emerging and developing world, it now expects growth of 3.4 percent, down from 3.6 percent it forecast last October. That said, growth is expected to improve from 3.1 percent in 2015!
It leaves China’s forecast unchanged at 6.3 percent, which would have nonetheless decelerated from 6.9 percent last year, while the U.S. is expected to grow at 2.6 percent this year, 0.2 percentage points less than previously expected.
The IMF nonetheless is higher than the consensus, which expects 2.5-percent growth this year, before decelerating to 2.4 percent in 2017.
Either way, if past is prologue, these are optimistic forecasts, and subject to downward revision.
Toward the end of last year, the consensus expected the U.S. economy to grow at 2.9 percent in 2015… we are lucky if we get two percent.
In the meantime, stocks are acting as if a U.S. recession is just around the corner. Should that take place, this would be the first time it would have contracted without the Fed tightening enough to invert the yield curve.
Even if there is no recession, it is a safe bet to assume that growth will be sub-par – maybe between one and two percent. The futures market has priced out another rate hike for the entire year. Well, that did not take long.
The FOMC’s dot plot – and the plan to hike four times this year – is not even worth mentioning.
The 10-year dipped below two percent before rising, and could continue to rise near-term. Daily technicals are oversold. Non-commercials expect as much, adding further to net shorts.
Currently net short 67.7k, up 24.6k.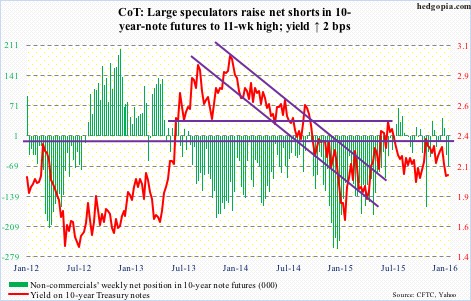
30-year bond: Major economic releases next week are as follows. It is going to be a busy week.
FOMC meeting begins on Tuesday and concludes the next day. This one does not have a press conference scheduled. It is likely a non-event, except the statement may drop a hint or two as to if the dot plot is a little too aggressive in its four-hike-this-year projection.
Also on tap on Tuesday is November’s S&P Case-Shiller housing price index. The national index, at an eight-year high, rose 5.2 percent annually last October. Notably, prices are still rising faster than inflation.
New home sales for December are due out on Wednesday. November was up 4.3 percent month-over-month to a seasonally adjusted annual rate of 490,000 units. The 12-month rolling average of 495,000 in that month was at a seven-year high. Rapid price appreciation is a potential stumbling block to this momentum. The median price in November was $305,000, not that far away from the all-time high of $310,400 in September last year.
The advance report on durable goods for December will be released on Thursday. The series seriously lacks momentum. Orders for non-defense capital goods ex-aircraft have dropped annually for 10 straight months. They peaked at $74 billion (SAAR) in September 2014, and were at $69.3 billion last November.
Also on Thursday comes out the pending home sales index, which dropped a point month-over-month in November to 106.9. The index has been dropping since 112.3 in May last year, which was at a nine-year high.
On Friday, we get GDP (4Q15 advance estimate), the employment cost index (4Q15) and the University of Michigan consumer sentiment index (final January).
Real GDP grew at a seasonally adjusted annual rate of two percent in 3Q15. The consensus expects growth of 1.4 percent in 4Q15, but the Atlanta Fed’s GDPNow, as of January 20th, is forecasting growth of merely 0.7 percent.
In 3Q15, total comp rose 1.9 percent annually – the second consecutive sub-two percent reading. Wages & salaries rose 2.1 percent, and benefits 1.4 percent.
Consumer sentiment’s preliminary reading for January was 93.3, up from 92.6 in December. It recently peaked at 98.1 in January last year – a 11-year high.
Currently net short 5.8k, up 4k.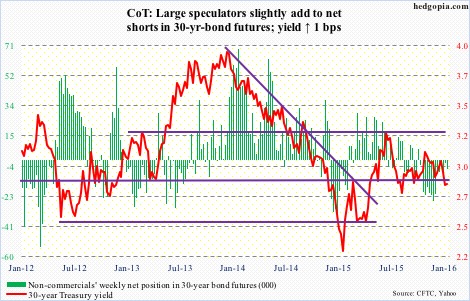
Crude oil: For the first time during the current bear market, a producing nation has expressed a desire to slash production, with the condition that OPEC should move first. A non-OPEC nation, Oman on Monday said it was willing to cut production by five to 10 percent.
On the other side of the spectrum, blaming unseasonably warm weather and rising supply, the IEA expects the crude oil market to remain oversupplied until at least late 2016.
The EIA report for the week of January 15th had more negatives than positives.
Crude imports fell by 409,000 barrels a day, to 7.78 million barrels per day.
Distillate stocks declined by a million barrel, to 164.5 million barrels. The prior week was the highest since the January 21, 2011 week.
However, crude stocks increased by four million barrels, to 486.5 million barrels. Five weeks ago, stocks were 490.7 million barrels, which was a stone’s throw away from the all-time high 490.9 million barrels in the April 24th week.
Production rose by 8,000 barrels per day, to 9.24 mbpd – a 21-week high. Production peaked at 9.61 mbpd in the June 5th week.
Refinery utilization fell by six-tenths of a percent, to 90.6 percent – a nine-week low. Utilization peaked at 96.1 percent in the August 7th week.
Gasoline stocks increased by 4.6 million barrels, to 245 million barrels. This was the 10th straight weekly increase, and at the highest since the March 16, 1990 week (no typo).
By Wednesday, spot West Texas Intermediate had dropped to $27.56 intra-day (not seen in the chart below as it uses weekly close). The EIA report should have added fuel to the fire. But it did not. Thursday, oil rallied, Friday it rallied even more.
The nearest resistance lies at $34-$34.50.
It will be interesting to see non-commercials reaction to this week’s action. Right on cue, they added to net longs this week. Last week, holdings were at the lowest since July 2012.
Currently net long 193.5k, up 17.5k.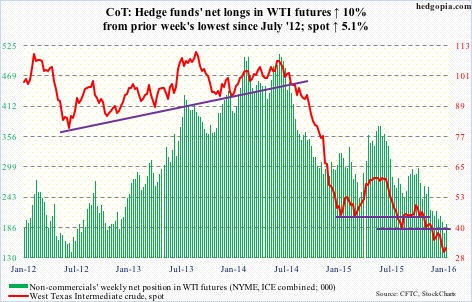
E-mini S&P 500: Here we go again! The usual sell-side optimism. The S&P just published 2017 operating earnings estimates for S&P 500 companies, and they are rosier than rosy.
As of January 21st, the consensus expects $140.69 next year, down from last week’s $141.11. Next year would be up 14.4 percent over this year, which, at $123, would be up 15.3 percent over 2015.
In all likelihood, next year’s estimates will meet the same fate as did estimates for 2015 and 2016. At the end of 2Q14, 2015 was expected to come in at $137.50, which has now been slashed to $106.65. Similarly, 2016 was at $137.50 in February last year.
The persistent downward revision is probably one reason why foreigners have been exiting U.S. stocks. In August through November last year, they sold $66 billion in equities. The last time the 12-month running total was positive was back in October 2013. And November last year was minus $107 billion – the highest monthly total ever.
Of late, domestic flows have not been cooperating either. From September 30th through Wednesday, nearly $35 billion left U.S.-based equity funds… just north of $26 billion in the year’s first three weeks alone (courtesy of Lipper).
Further, in the week ended Tuesday, $368 million came out of SPY, the SPDR S&P 500 ETF (courtesy of ETF.com).
No wonder stocks have been taken to the woodshed. But this very factor is a reason to expect a reprieve – at least near term.
On Wednesday, the S&P 500 found support off of April/October 2014 lows, and staged a massive reversal, further building on it on both Thursday and Friday.
The path of least resistance is up, with the nearest major resistance at 1990.
Right before the Wednesday reversal, non-commercials raised net shorts to a 13-week high, and could get squeezed.
Currently net short 188.5k, up 26.3k.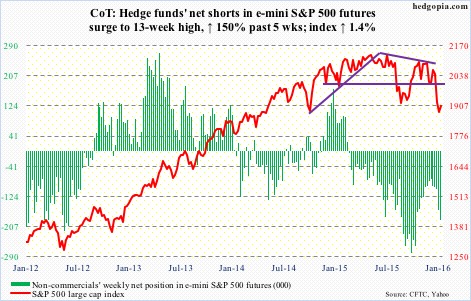
Euro: Mario Draghi, ECB president, is hinting at more stimulus as early as March.
Speaking to reporters post-governing council meeting on Thursday, he said downside risks had increased at the start of the year. “It will therefore be necessary to review and possibly reconsider our monetary policy stance at our next meeting in March.”
The euro only fell 0.14 percent in that session.
Traders are probably confused. As early as December 3rd, they pushed the currency up 3.1 percent in one session after Mr. Draghi failed to live up to expectations of dovish action/message. The recent rout in equities has forced him to do a 360. One more example of central bankers trying to calm down nervous markets with talk of more stimulus.
Non-commercials continue to reduce net shorts, which have now been cut to an 11-week low.
Currently net short 137k, down 9.4k.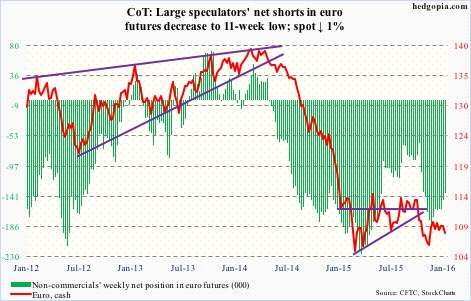
Gold: Spot gold has probably not benefited as much as it should have in the current carnage.
That said, there is some technical improvement.
It has managed to rally past resistance at 1,080 and stayed above, with the 50-day moving average no longer dropping. There is now a bullish weekly MACD crossover.
The 200-day moving average lies at 1,135, which approximates resistance at 1,140-ish.
Currently net long 43.7k, down 1k.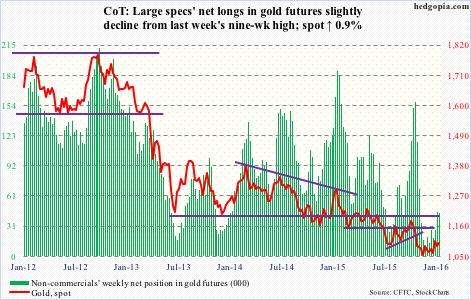
Nasdaq 100 index (mini): The Wednesday reversal was impressive – down 3.7 percent at one point but ended the session down 0.26 percent.
In a larger scheme of things, the index is still down 10 percent off December’s all-time highs. In many ways, the two-week drop has ominous look to it. The only way it is negated is if flows improve.
In the week ended Tuesday, $428 million came out of QQQ, the PowerShares QQQ ETF, (courtesy of ETF.com). That was just before the Wednesday reversal. Would this advance tempt inflows? This will hold the key as to how far this rally goes.
For them to be taken seriously, bulls need to clear resistance at 4350, which goes back to November 2014.
Non-commercials reduced net longs further, to a 14-week low.
Currently net long 29.1k, down 4.2k.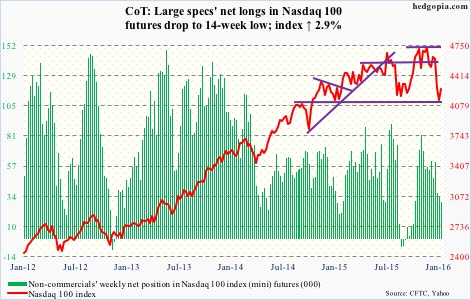
Russell 2000 mini-index: In the midst of the sell-off on Wednesday, small-caps were one of the areas that began to attract bids. Bio-techs were another. When it was all said and done, the Russell 2000 ended up 0.45 percent, reversing an earlier 3.7-percent drop.
In the following two sessions, the Russell 2000 struggled to garner the same momentum.
In the week ended Tuesday, $1.3 billion came out of IWM, the iShares Russell 2000 ETF, (courtesy of ETF.com). In all likelihood, these sellers will take their time to put their toes back into the water, if at all.
Sentiment can improve a whole lot if the index can conquer two-year resistance at 1080.
Currently net short 54.9k, down 159.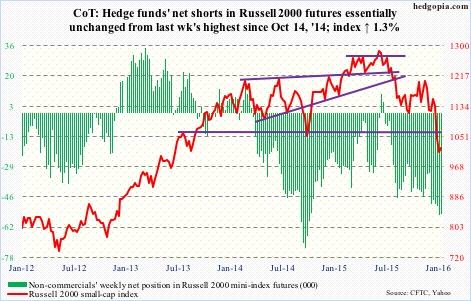
US Dollar Index: Has hugged the 50-day moving average since early December. The average is now beginning to flatten out.
Having failed to appreciably rally during the recent market mayhem, the path of least resistance near-term is probably down.
That said, the index is not that far away from the highs of March and November last year. And non-commercials continue to act like they do not anticipate a breakout. Holdings are substantially less versus back then.
Currently net long 42.8k, up 56.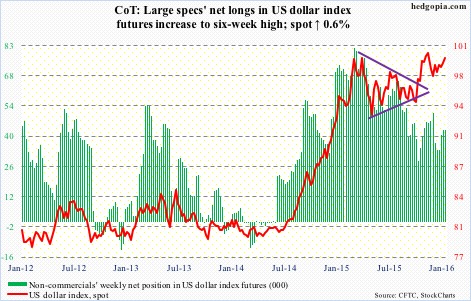
VIX: Several times in the past week or so, spot VIX would repeatedly spike intra-day only to close substantially off sessions highs. This was once again in evidence on Wednesday when the spot shot up to 32.09, only to close at 27.59.
This inability to hang on to gains was a big tell. Friday, VIX fell out of a three-week rising channel. More weakness probably lies ahead. The 50- and 200-day moving averages lie at 19.38 and 17.28, in that order.
And this! Non-commercials went net long. The last time they shifted from net short to net long was on August 25th; the S&P 500 bottomed a day earlier.
Currently net long 9.5k, up 16.1k.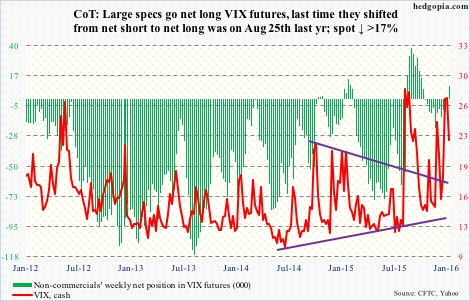
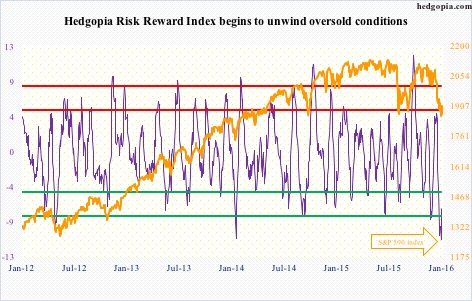
Hedgopia Risk Reward Index