The following are futures positions of non-commercials as of March 1, 2016. Change is week-over-week.
10-year note: Unbelievable! The Japanese government is getting paid to borrow money for a decade. For the first time ever, Japan sells 10-year bonds at negative yield. Along with Denmark, Sweden, Switzerland and the Eurozone, Japan is one of the countries to institute negative interest rate policy.
Speaking of which, the ECB meets next week, and may further cut the deposit rate (currently minus 0.3 percent).
The week after, the Fed meets. For sure, it will stand pat. Despite mid-December (2015) dot-plot forecast of four rate hikes this year, the goal post continues to shift. The focus now is on average hourly earnings, where progress is slow in coming.
On Monday, China cut its reserve requirement ratio by 0.5 percentage point (taking the level to 17 percent for the biggest banks). The idea is to enable banks to lend more, and they will oblige.
What is the message in all this? That the patient is sicker, and not getting better? That the various central-bank measures adopted so far have failed to yield the desired results?
Throughout this experiment, debt – which is what led to the 2008/2009 financial crisis in the first place – has continued to rise. In the aggregate, that is.
In China, for instance, government and household debt look fine, but not corporate debt, which is elevated. Most of these corporations are state-owned enterprises, which is essentially government debt. Credit rating agencies are beginning to raise yellow flags.
If there is one lesson from the financial crisis, it is that continued credit creation cannot cure problems that emanated from excess credit. Yet we keep doing it.
Tick tock, tick tock…
Currently net long 2.6k, down 82.1k.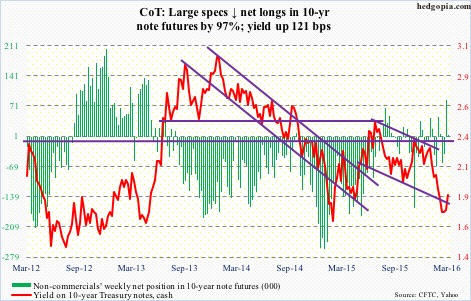
30-year bond: Major economic releases next week are as follows. It is a light week.
Consumer credit for January comes out on Monday. December was up 0.6 percent month-over-month to $3.55 trillion (seasonally adjusted). Over the years, this series has seen healthy growth – was $2.59 trillion when the economic recovery began in July 2009. Most prominent – and ominous – is the growth seen in student and auto loans. The former has gone from $711 billion in 2Q09 to $1.32 trillion in 4Q15, and the latter from $742 billion to $1.04 trillion.
Tuesday brings the NFIB survey. In January, its optimism index fell 1.3 points to 93.9 – the lowest since February 2014 (91.6). The index reached a cycle high in December 2014 at 100.3, which was the highest since 100.7 in October 2006. Some other notables: Comp plans fell six points month-over-month in January to 15, a five-month low, while capex plans have remained unchanged at 25 the past three months.
Stanley Fischer, Fed vice chair, speaks on Monday during market hours.
Currently net long 24.1k, up 1.1k.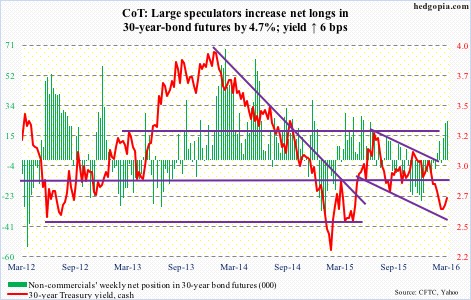
Crude oil: Apparently, key OPEC members are meeting with non-OPEC oil producers on March 20th for talks on output freeze plan. Hopes are high. And this is what is driving price action right now.
Spot West Texas Intermediate crude broke out of $34-$34.50 resistance on Friday, joining XLE, the SPDR energy ETF, which broke out of resistance at $58.50 on Wednesday.
Right at this moment, market participants do not seem all that focused on other data.
U.S. crude supply continued to build. In the week ended February 26th, inventory rose by another 10.4 million barrels to a new record 518 million barrels. Supply has gone up by nearly 36 million barrels in the past eight weeks!
Despite this domestic supply, crude imports rose by 490,000 barrels per day to 8.3 million barrels per day – an 11-week high.
Distillate stocks rose as well, by 2.9 million barrels to 163.6 million barrels – a six-week high.
Gasoline stocks, however, fell… by 1.5 million barrels to 255 million barrels. Two weeks ago (258.7 million barrels), stocks were at a record.
Production fell, too – by 25,000 bpd to 9.08 mb/d. This was a sixth straight weekly drop. Production reached a record 9.61 mb/d in the June 5th (2015) week.
Also, refinery utilization rose a percentage point to 88.3. Utilization peaked at 96.1 percent in the August 7th (2015) week.
Last week saw the largest week-over-week increase in non-commercials’ net longs since October 2010. This week, they added more.
Besides the afore-mentioned breakout, the good thing is that the 50-day moving average is beginning to flatten out on WTI. A base is building.
A lot now depends on what comes out of the March 20th meeting. Suppose the talks fail and oil continues to rally? That would validate the breakout.
Currently net long 218.1k, up 11.3k.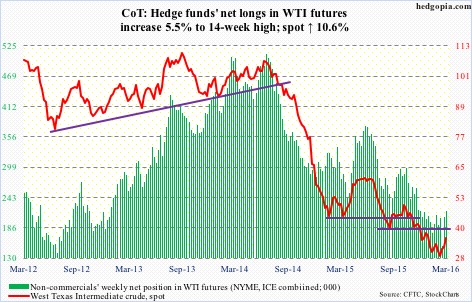
E-mini S&P 500: They did it. The bulls were able to take out 1950, as well as the 50-day moving average, which is now beginning to flatten out. If they also succeed in convincingly breaking out of 1990, then that has the potential to cause more squeeze.
In the latest reporting period (January 29-February 12), short interest on SPY, the SPDR S&P 500 ETF, fell 3.5 percent period-over-period to 283.5 million, which is 35 percent less than during the September 15th period. On an index level, though, the picture is different.
Mid-February short interest on the NYSE composite was 18.5 billion – just 0.5 percent from the July 2008 all-time high of 18.6 billion. On the Nasdaq composite, the latest tally was 9.1 billion, much lower than record 11.2 billion in July 2008, but the trend is up.
If the bulls continue to put upward pressure on prices, the high level of short interest can cause the mother of all squeezes. For this to happen, stocks need inflows. And that is the issue.
In the week ended Wednesday, another $2.4 billion came out of U.S.-based equity funds (courtesy of Lipper). The 1950 breakout took place on Tuesday, and longs used that to exit, not pile on. Stocks in general bottomed on February 11th. Since then, not a single week has seen inflows; cumulatively, outflows have totaled north of $12 billion.
This should reverse if the current uptrend in equities were to sustain itself. If flows do not improve soon, this rally will have built on a heap of sand.
Currently net short 191.4k, down 16.7k.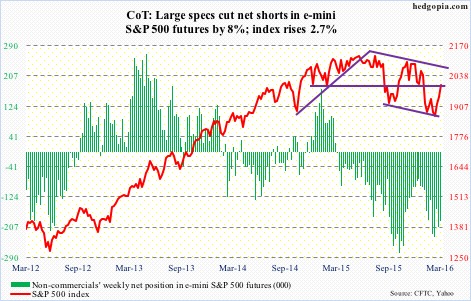
Euro: Consumer price inflation in the Eurozone fell for the first time in five months in February. The 0.2-percent drop followed a 0.3-percent increase in January. Core CPI rose 0.7 percent, down from one-percent increase in January. Unlike the Fed, the ECB prefers to look at the headline number.
Not only is inflation failing to show up, but expectations continue to remain muted as well, evident in five-year, five-year forwards and breakeven rates.
This probably gives more ammunition to ECB doves to demand more stimulus come March 10th, when the governing council meets. But a more pertinent question is, why has not the current policy yielded results?
Even more important, what can the bank do? The ECB already have a stimulus plan in place. Rates have already been pushed into negative territory – a development that, by the way, has ended up hurting European financials.
Nonetheless, the bank will probably end up expanding its QE (currently €60-billion/month in purchases) and maybe even cut the deposit rate deeper into negative territory. Odds are Mario Draghi, ECB president, will end up underwhelming market’s lofty expectations.
In this scenario, the euro can rally – at least near term. In fact, on both Tuesday and Wednesday, the lower Bollinger Band provided support, and it has room to continue to rally on a daily chart.
The currency just lost 111 support, and a test of that resistance is possible. The now slightly declining 200-day moving average lies at 110.47, which was tested on Friday.
Currently net short 68.5k, up 21.7k.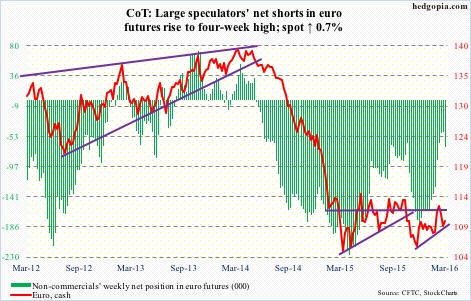
Gold: Despite the extremely overbought daily conditions and signs last week spot gold was ready to at least retest 1180 breakout, all it did was an intra-day drop to 1216 on Monday. And that was it. Buyers swooped in.
Flows are cooperating. In the four sessions ended Wednesday, GLD, the SPDR gold ETF, pulled in another $1.1 billion. So far this year, the ETF has attracted $5.4 billion.
Technically, the week also completed a daily golden crossover, so that probably created a lot of positive buzz. Plus, the spot broke out of a pennant/ascending triangle. These are continuation patterns, and are most reliable when found in an uptrend, and that is the case here.
Once again, non-commercials have been spot-on. They continued to accumulate during the two prior weeks when gold pretty much went sideways, and have been rewarded.
The spot was up 3.1 percent for the week. But here is the thing. Friday, it rallied 1.3 percent intra-day but closed the session down 0.4 percent. It was a high-volume reversal, producing a long-legged doji right outside the upper Bollinger Band. One more sign of fatigue.
Currently net long 152.4k, up 7.4k.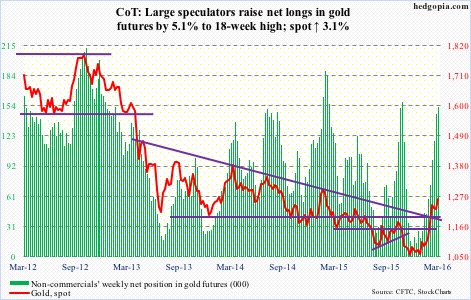
Nasdaq 100 index (mini): With a mini breakout on Tuesday, the index sits right underneath major resistance at 4300-4350.
In fact on Friday, post-jobs report,5the upper end of that resistance was tested – unsuccessfully.
Flows continue not to cooperate. From February 11th through this Wednesday, $637 million left QQQ, the PowerShares Nasdaq 100 ETF. This, despite $595 million in inflows on February 29th.
Currently net long 13.9k, up 11k.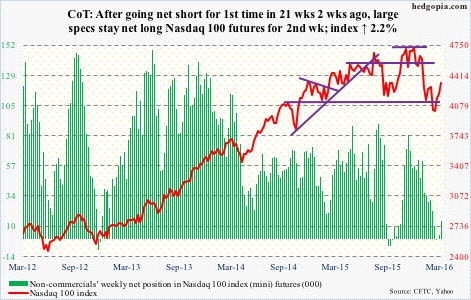
Russell 2000 mini-index: U.S. small-caps are outperforming their other peers. Off the February 11th intra-day low, the Russell 2000 is up nearly 15 percent – better than any other major U.S. index. Granted this preceded a 22-percent collapse in about 10 weeks, but price action has improved, with improving money flow.
Since February 23rd through Wednesday this week, $812 million moved into IWM, the iShares Russell 2000 ETF. That said, a lot more was redeemed during the sell-off. This year through the February 11th low, $1.2 billion left. Even since the February 11th low through Wednesday this week, $738 million was redeemed (courtesy of ETF.com). But the most recent trend is encouraging.
The only question is, what should we make of this?
For now, there is an increase in risk-on sentiment. In the four sessions ended Wednesday, $963 million moved into JNK, the SPDR high-yield bond ETF (courtesy of ETF.com).
That said, defensives such as XLP, the SPDR consumer staples ETF, and XLU, the SPDR utilities ETF, continue to hover near their all-time highs.
As well, the yield spread between two- and 10-year Treasury notes dropped to 96 basis points in the last two sessions of February – the narrowest spread since December 20, 2007. The bond market continues to forecast subdued economic activity – not something conducive to small-caps that are inherently more domestically focused.
Yet, they are rallying – hard. In this respect, what happens at 1080 resistance is worth a close watch. If a breakout occurs, would non-commercials unwind their net shorts? Thus far, they are sticking with their bearish bias, and given their record, they are worth paying attention to.
Currently net short 61.2k, up 3.1k.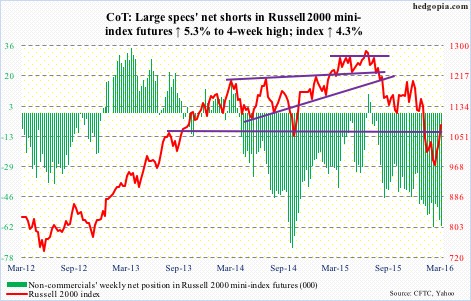
US Dollar Index: Non-commercials have got it so right. They have been cutting back net longs for a while, with holdings now the lowest since August 2014. The dollar index cannot get going.
Off the February 11th low through Wednesday’s intra-day high, it rallied 3.5 percent, raising dollar bulls’ hopes. Then the uptrend got cut short Thursday – the day ISM non-manufacturing disappointed – dropping 0.6 percent. The 50-day moving average has been lost. Friday, it dropped more, testing the 200-day moving average.
The path of least resistance near-term? Probably down.
Currently net long 26.8k, down 2.6k.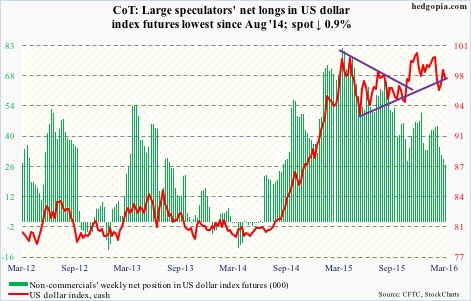
VIX: To put it simply, weekly indicators proved too powerful for the daily ones.
Last week, VIX had a weekly bearish MACD crossover. But daily indicators were grossly oversold, with the 200-day moving average seeming to provide support. Well, that average has now been lost – the first drop below 200-DMA since December 29th.
Spot VIX fell another 15 percent this week. With daily momentum indicators remaining oversold for one more week, it remains compressed, with the potential to act like a spring once released. If Friday is a sign of things to come, next week will be interesting; VIX refused to go down despite an up day for stocks.
Currently net long 23.3k, down 2.6k.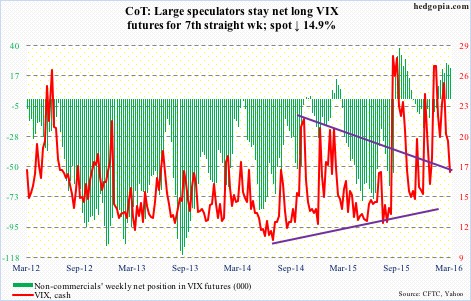
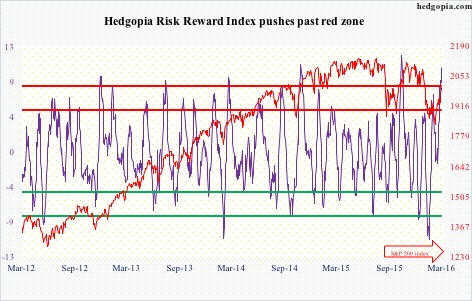
Hedgopia Risk Reward Index