The following are futures positions of non-commercials as of March 22, 2016. Change is week-over-week.
10-year note: This could not get any funnier.
A week after the FOMC statement, and later Janet Yellen, Fed chair, shifted message from hawkish to dovish, comes out comments from James Bullard, St. Louis Fed president and a voting member, that policy makers should consider raising interest rates in April amid prospects of unemployment and inflation exceeding targets.
On Wednesday, the dollar in particular reacted positively to his hawkish statement.
Mr. Bullard also said the dot plot is probably counterproductive. Agreed. But so is the current custom of FOMC members expressing opinion on policy matters at free will. This is as counterproductive. Markets only get confused by disparate messages. As they did this week.
Currently net long 50.1k, down 15k.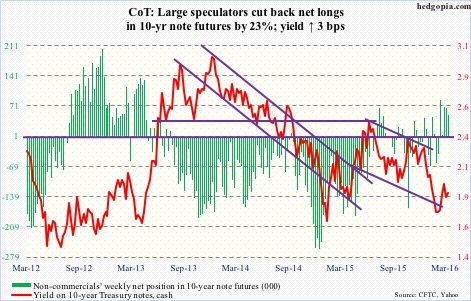
30-year bond: Major economic releases next week are as follows.
Monday brings February’s personal income data. All eyes will be focused on core PCE (personal consumption expenditures) inflation. January prices rose at 1.67 percent annually. This is below the Fed’s two-percent target, but has been trending higher since 1.26-percent increase last July. Core PCE has been trending higher with core CPI. The latter was up 2.33 percent annually in January, and has increased north of two percent the past four months.
Also on Monday comes out February’s pending homes sales index. January was down 2.5 percent month-over-month to 106. Most recently, it peaked last April at 111.2. The index tends to correlate with sales of existing homes. The latter dropped 7.1 percent m/m in February to a seasonally adjusted annual rate of 5.08 million units.
The S&P Case-Shiller home price index for January is published on Tuesday. The national index rose at 5.4 percent year-over-year in December. Price appreciation has decelerated from the double-digit pace two years ago, but has trended higher since rise of 4.3 percent last February.
On tap on Friday are employment report (March), ISM manufacturing (March), and the University of Michigan’s consumer sentiment (final March).
In the first two months this year, non-farm payroll averaged 207,000, slower than 243,000 in 2015 but faster than 178,000 in 2014. The unemployment rate was 4.9 percent this February, versus 5.5 percent a year ago and 6.7 percent two years ago. Wage pressure is still not showing up. Average hourly earnings of private-sector employees rose at an annual rate of 2.2 percent in February. The last time they grew with a three handle was in April 2009.
ISM manufacturing has remained sub-50 the last five months – the longest stretch of contraction since recovery began in July 2009. February new orders were flat m/m at 51.5, with three sub-50 readings the past six months.
The preliminary March reading of consumer sentiment came in at 90, down 1.7 points m/m. Sentiment peaked at 98.1 in January last year in the current cycle.
Five FOMC members are scheduled to speak during weekdays, including Ms. Yellen (at noon on Tuesday).
Currently net long 50k, up 7.7k.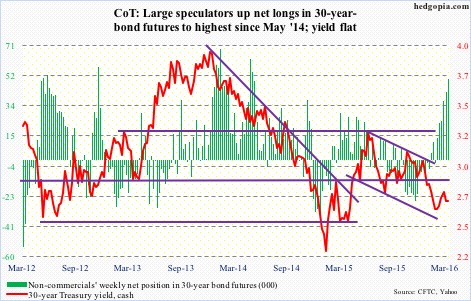
Crude oil: So a deal among some OPEC members and Russia to freeze production is meaningless as Saudi Arabia is the only country with the ability to increase output, according to a senior IEA official.
Mid-February, Saudi Arabia and fellow OPEC members Qatar and Venezuela agreed with Russia (non-OPEC) to freeze output at January levels. Libya and Iran are not going along. Not sure how much the IEA comment contributed to crude oil’s decline this week.
Technicals definitely did.
Last Friday, spot West Texas Intermediate crude produced what looked like a shooting star near its 200-day moving average. Right above lied another layer of resistance at 43.50 going back to January 2015. Off the February 11th low, oil rallied 63 percent, so fatigue was setting in.
Plus, U.S. crude supply continued to rise. Yet another record. In the week ended March 18th, stocks rose another 9.4 million barrels to 532.5 million barrels. In the past 11 weeks, inventory has gone up by 50.2 million barrels!
Crude imports rose, too, by 691,000 barrels/day to 8.4 million b/d. This was the highest since June 2013.
Markets had been ignoring the parabolic rise in inventory, instead focusing on gasoline stocks, which dropped by another 4.6 million barrels to 245 million barrels. Stocks are now down by 13.6 million barrels in the past five weeks.
Similarly, crude production fell by 30,000 b/d to nine mb/d. Production reached a record 9.61 mb/d in the June 5th (2015) week.
Distillates, however, rose, by 917,000 barrels to 162.3 million barrels. And refinery utilization fell by six-tenth of a percent to 88.4 percent.
On March 16th, spot WTI broke out of resistance at 38 and change. That support was tested on Thursday – successfully. Daily overbought conditions have unwinding left still. Odds favor crude continues to come under pressure next week. There is good support at just below 35.
Non-commercials continue to add net longs – now at 21-week high.
Currently net long 308.7k, up 41.3k.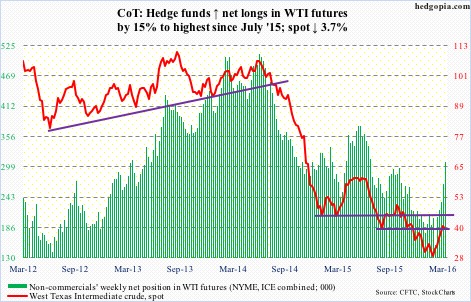
E-mini S&P 500: Had difficulty saving last Friday’s 2040 breakout, with Tuesday producing a long-legged doji. The early weakness on Thursday was bought right on mini straight-line support – just above the 200-day moving average. The session produced a long lower shadow (bullish); however, if it is a hanging man (bearish), suggesting that selling pressure is starting to increase, it needs confirmation. Right now, the index is sitting right on its 10-day moving average, which could begin to go flat.
For the week, the index dropped 0.7 percent – first drop in six weeks. The $1.4 billion that moved into SPY, the SPDR S&P 500 ETF, in the week ended Wednesday is now under water; in fact, Monday through Wednesday, the ETF pulled in $4.1 billion (courtesy of ETF.com). Some level of distribution is taking place.
Also, Lipper data show that $2 billion moved into U.S.-based equity funds in the week ended Wednesday – second inflows in three weeks netting $4.5 billion. Encouraging trend, but probably too little to negate the prevailing trend. Since February 10th, $7.9 billion has been redeemed. The S&P 500 bottomed on February 11th.
Currently net short 146.4k, down 59.5k.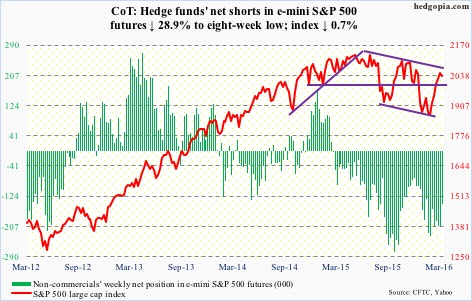
Euro: The Markit PMI for the Eurozone rose to 53.7 in March from 53 in February. However, businesses only reported a slight increase in new orders and hiring.
On March 10th, the ECB cut growth forecast for 2015 from 1.7 percent to 1.4 percent. It also announced a whole host of stimulus measures, including further reductions in key interest rates, additional purchases of government bonds and a new purchase program of corporate bonds, as well as a new program of cheap, medium-term loans.
Too soon to say if any of this would have meaningful impact on the economy. If past is guide, it will be prudent to fade the optimism.
The euro did exactly that – 1.6 percent higher than just prior to the March 10th decision.
That said, after giving out signs last week that it was headed lower near-term, the euro likely is not done going down. The 200-day moving average lies at 110.48, and likely gets tested.
Currently net short 66.1k, down 11.5k.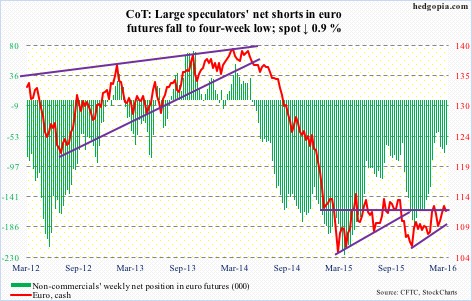
Gold: Spot gold finally caved.
As had been continuously pointed out on this blog, with the metal having essentially gone sideways since February 11th even as GLD, the SPDR gold ETF, was attracting loads of money and non-commercials were adding to net longs, risks were rising that they would run out of patience.
In the week ended Wednesday, GLD lost $375 million, on the heels of $4.1 billion in outflows in the prior week (courtesy of ETF.com).
Similarly, for the first time in eight weeks, non-commercials last week cut net longs. This week, they added, up 5.5 percent. That said, holdings are as of Tuesday, and the spot lost 2.6 percent since. Makes it harder to hang on to these longs.
On a weekly chart, spot gold has plenty of room to continue unwinding its overbought conditions. With a 10/20 daily crossover, the immediate risk for the metal is breakout retest of 1180. The rising 50-day moving average lies at 1195. This price range is a must-hold.
Currently net long 178.8k, up 9.3k.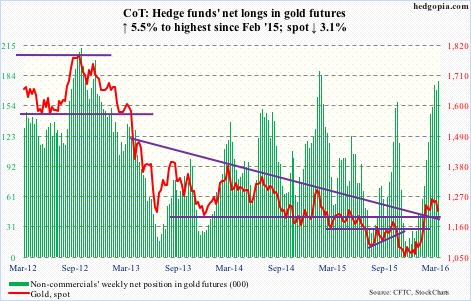
Nasdaq 100 index (mini): Could have had six straight weeks of advance but missed by a mere five points. The index dropped 0.1 percent for the week, outperforming its major peers.
Amidst plenty of push and pull between bulls and bears, the index produced a weekly doji – possibly a signal that buying pressure is starting to weaken. If so, this is a win for the bears.
The index is still above 4350, but barely. As well, after a brief stay above the 200-day moving average, it is back under. QQQ, the PowerShares Nasdaq 1000 ETF, longs were not convinced the breakout was real, withdrawing $468 million in the week ended Wednesday (courtesy of ETF.com).
Currently net long 8k, up 12.4k.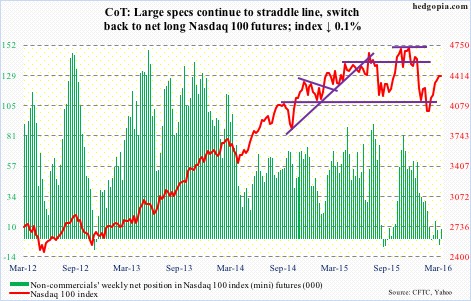
Russell 2000 mini-index: Just suffered a daily bearish MACD crossover, and is literally sitting on 1080 support.
Shorter-term moving averages are beginning to go flat but are yet to roll over – a development that could very well be in the works. For the week, the index dropped two percent – much sharper than most of its U.S. peers.
IWM, the iShares Russell 2000 ETF, attracted $1.4 billion in the week ended Wednesday – $1.6 billion in the last two sessions (courtesy of ETF.com). These funds are now in the red, and will probably only get worse. The immediate risk is a drop to support at 1035, which also approximates the 50-day moving average.
Currently net short 60.8k, down 2.7k.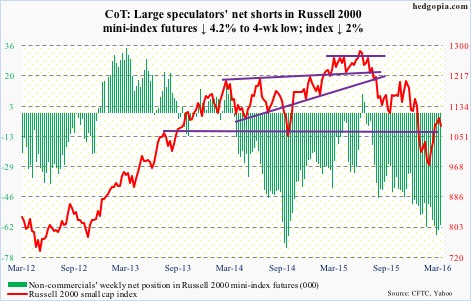
US Dollar Index: Rallied 1.1 percent in the week. Mr. Bullard’s comments possibly helped, but more importantly, it was probably looking for a reason to rally.
The index was meted out a harsh punishment last week when it dropped nearly two percent on Wednesday and Thursday, reacting to the Fed’s dovish shift. That also pushed daily momentum indicators into deep oversold territory. Now, weekly indicators are oversold as well.
The area of interest continues to be 97.
The index could very well be in the midst of a rebound near term. For that to transpire, it has to win back the broken May 2015 trend line.
That said, unless 100-101 is convincingly taken out, odds are decent that an important top has been reached.
Too early to take this as a signal, but for the first time in seven weeks, non-commercials added to net longs, albeit by a mere 0.9 percent.
Currently net long 17.7k, up 163.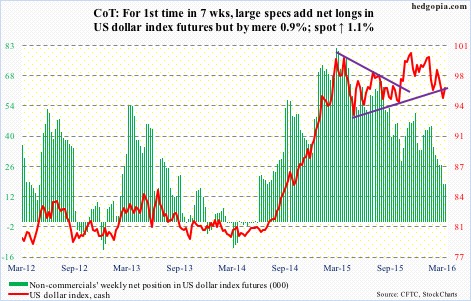
VIX: Spot VIX’s rally attempt on Thursday was repelled by its 20-day moving average. The bottoming process continues, with a weekly long-legged doji. Daily MACD is on the verge of a bullish crossover. And, the VIX to VXV ratio has dropped into oversold zone.
Here is a potentially important development. After nine weeks of staying net long, non-commercials switched to net short. The last time such a switch occurred was on October 27th last year, with the S&P 500 peaking on November 3rd.
Currently net short 4k, down 14.3k.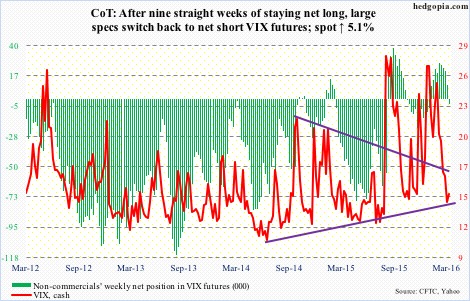
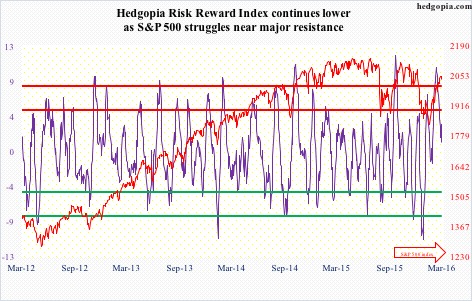
Hedgopia Risk Reward Index