The following are futures positions of non-commercials as of March 29, 2016. Change is week-over-week.
10-year note: The back and forth between the two camps within the FOMC continues. Last week, several members used public forums to express hawkish opinion as regards to interest rates’ path going forward. James Bullard, St. Louis Fed president, was quoted the most.
At the Economic Club of New York this Tuesday, Janet Yellen, Fed chair, vehemently pushed back at those hawkish voices.
To be fair, Ms. Yellen did not say substantially different from her dovish post-FOMC press conference on March 16th. But she probably felt the need to reiterate herself, with some added color, in order to silence the growing chorus of hawkish voices.
She has succeeded so far. Since her Tuesday speech, stocks are up (wealth effect), the dollar is down (oil up; and positive for exports), Treasury yields down (positive for housing, etc.), among others.
As the two camps go about freely expressing opinion in public appearances, markets increasingly are getting whipsawed. Too much transparency out there.
Currently net short 16.9k, down 67k.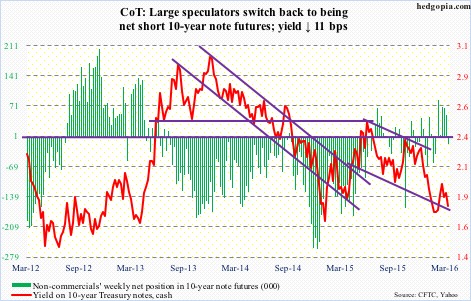
30-year bond: Major economic releases next week are as follows.
The advance report on February’s durable goods was published on March 24th. Revised estimates plus non-durable goods data come out on Monday. Preliminarily, orders for non-defense capital goods ex-aircraft – proxy for business capital expenditures – fell 1.8 percent in February to a seasonally adjusted annual rate of $67.4 billion, and are down for 13 straight months on an annual basis. They peaked at $74 billion in September 2014.
On Tuesday, we get JOLTS (February) and the ISM non-manufacturing index (March).
Job openings rose by 260,000 in January month-over-month to 5.54 million. They peaked at 5.79 million last July.
Unlike its manufacturing cousin, non-manufacturing has been faring much better. That said, services are in deceleration as well. February was 53.4, down from 59.6 last July. Similarly, February orders came in at 55.5, down from 62.6 last July.
FOMC minutes for the March 15-16 meeting are published on Wednesday. Ms. Yellen’s Tuesday speech has probably trumped the significance of these minutes.
On Thursday, consumer credit for February is published. January was up 6.5 percent y/y to a seasonally adjusted annual rate of $3.54tn. Most notably, over the years, student loans have soared to $1.32 trillion, and auto loans to $1.04tn.
Seven FOMC members are scheduled to speak during weekdays, including Ms. Yellen (at 5:30 PM on Thursday).
Currently net long 59.9k, up 9.9k.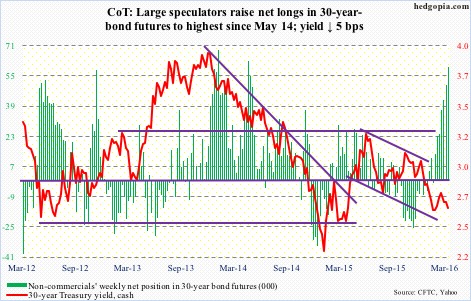
Crude oil: Spot West Texas Intermediate crude has come under pressure since it was rejected at its 200-day moving average two weeks ago. On a weekly chart, there is plenty of room for the crude to continue heading lower.
Should the trend continue, 34.50 is the line in the sand. Spot WTI broke out of it nearly a month ago. If the breakout is real, there should be plenty of buy orders waiting to pounce on the opportunity. This price point is also about where the 50-day moving average lies.
On the fundamental front, the momentum in buildup of crude inventory continued in the week ended March 25th. Stocks rose by 2.3 million barrels to 534.8 million barrels – now up 52.3 million barrels in the past 12 weeks. Massive!
Bloomberg, by the way, reported that the all-time high was reached in 1929 when stocks hit 545 million barrels.
Crude imports fell by 636,000 barrels per day to 7.7 million b/d. There were other positives as well.
Both gasoline and distillate stocks fell – the former by 2.5 million barrels to 242.6 million barrels, and the latter by 1.1 million barrels to 161.2 million barrels. Gasoline stocks have declined by 16.1 million barrels in the past six weeks.
Refinery utilization rose by two percentage points to 90.4 – a 10-week high.
Crude production, too, fell by 16,000 b/d to nine mb/d. Production reached a record 9.61 mb/d in the June 5th (2015) week.
Currently net long 302k, down 6.6k.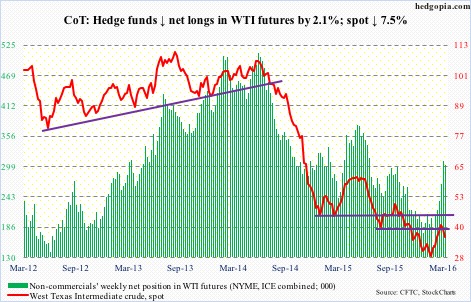
E-mini S&P 500: Here is some good and some bad. On Tuesday, the S&P 500 rallied 0.9 percent to retake 2040. Longs, however, used that as an opportunity to cash in. SPY, the SPDR S&P 500 ETF, lost $1.4 billion in that session. For the week ended Wednesday, it lost $381 million (courtesy of ETF.com).
Lack of inflows has been a persistent problem in the current rally, which started on February 11th. Since the week ended February 10th, $10.5 billion has left U.S.-based equity funds, with $2.6 billion leaving in the week ended Wednesday (courtesy of Lipper).
What would the magnitude of the rally be if flows had cooperated? Makes you wonder. Also wondering if margin debt saw a sizable pickup in March. The S&P 500 jumped 6.6 percent in the month.
February saw another decrease in NYSE margin debt, down $11.9 billion m/m to $435.8 billion. Since the April 2015 peak of $507.2 billion, it is now down $71.3 billion. It is headed the wrong direction, and needs to reverse direction if the rally since February 11th is real.
Thus far, price action remains solid. A potential problem: The index is right at the declining trend line from last July.
Currently net short 122.1k, down 24.3k.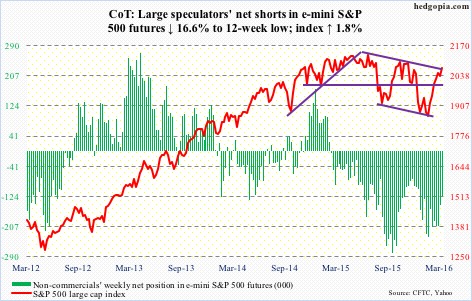
Euro: Annual inflation in the Eurozone in March was minus 0.1 percent, following minus 0.2 percent in February. Prices are still falling, and are a long way from the ECB’s target of close to two percent. The bank expects inflation to be only 0.1 percent this year.
Core inflation, however, was one percent in March, versus 0.8 percent in February. Maybe the collapse in energy prices is suppressing the headline inflation number after all.
That said, this is one more data point bolstering doves’ voices within the ECB. The question is, did Mario Draghi, ECB president, go all in on March 10th? The euro is definitely acting like he has. Intra-day, between March 10th and April 1st, it rallied 5.7 percent.
With this, the euro has reached a critical juncture. On Friday, it retreated from hitting a high of 114.38. This is an area of strong resistance going back to January 2015. A breakout here would be massive, but with very low odds right at this moment.
Particularly on a daily chart, the euro remains grossly overbought, with Thursday producing a shooting star. This came in the wake of a long-legged doji on Wednesday. The currency is tired. Time to test support. The likely area of interest lies just under 111, which also approximates the 50- and 200-day moving averages. By the way, for whatever it is worth, the currency just completed a golden cross.
Currently net short 63.8k, down 2.2k.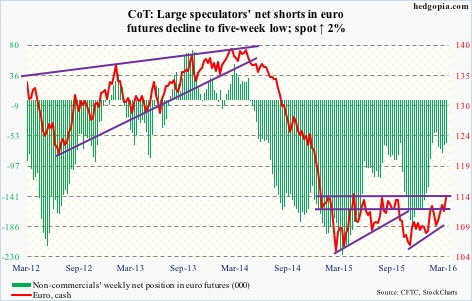
Gold: On Tuesday, the day Ms. Yellen delivered her uber-dovish speech, spot gold jumped 1.7 percent. Shorts in GLD, the SPDR gold ETF, probably got creamed in that session. As of the middle of March, short interest stood at 13.4 million shares – a five-month high and up 52 percent this year.
Rather revealingly, on Tuesday and Wednesday combined, $175 million left GLD (courtesy of ETF.com).
There is room to rally on a daily chart, but the metal is not gaining traction. Inflows are needed.
The good thing, from gold bugs’ perspective, is that in the recent sell-off the 1180 level has so far not even come close to being retested. The metal is finding support at 1200-plus, which is where the rapidly rising 50-day moving average finds itself.
Weekly indicators continue to want to go lower. Let us see if gold bugs step up to save daily support. On a monthly chart, after strong January and February, March produced a doji. Bulls and bears are on an even keel.
Currently net long 189.8k, up 11k.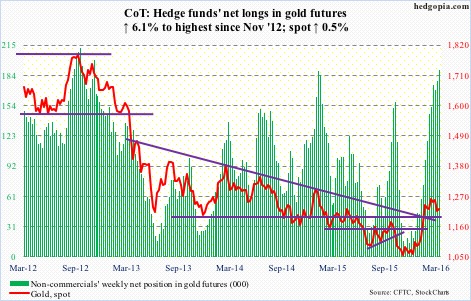
Nasdaq 100 index (mini): A day after breaking out of its 200-day moving average on Tuesday, the Nasdaq 100 flashes a shooting star just outside the upper Bollinger Band. Come Friday, the index rallies 1.1 percent to essentially nullify the potentially bearish candle.
Nonetheless, should weakness set in, it will be interesting to see if 200-DMA (4420) generates buying interest, followed by horizontal support at 4350 going back to November 2014.
If Tuesday and Wednesday this week are an indication, there is reason to be hopeful. QQQ, the PowerShares Nasdaq 1000 ETF, hauled in $549 million on those two days, more than offsetting the $468 million withdrawn in the week ended Wednesday last week (courtesy of ETF.com).
Currently net long 21.1k, up 13.2k.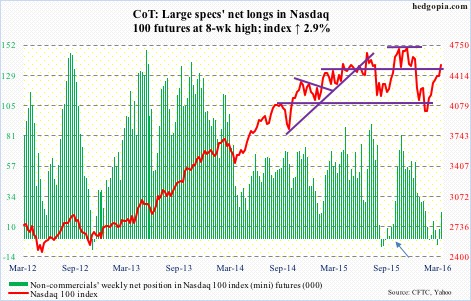
Russell 2000 mini-index: Small-cap bulls got a lot to cheer about this week.
Thanks to Ms. Yellen, the Russell 2000 on Tuesday broke out of three-week congestion. It is now past 1080 resistance. Last week saw a daily bearish MACD crossover, which was negated this week.
The index peaked last June, a month after the S&P 500 did. A trend line drawn from that peak descends to 1140, which is where its 200-day moving average lies. That is another two percent from here.
Does this run that began on February 11th have enough juice left to go test that resistance? If money starts flowing in, anything is possible. Short interest in IWM, the iShares Russell 2000 ETF, has gone up 8.5 percent in the past month to 111.1 million shares (as of mid-March), which could get squeezed in the right circumstances.
However, in the week ended Wednesday, IWM lost $256 million. This followed $1.4 billion in inflows in the prior week (courtesy of ETF.com).
Non-commercials continue not to buy into the current rally, and they have been wrong so far.
Currently net short 63.7k, up 2.9k.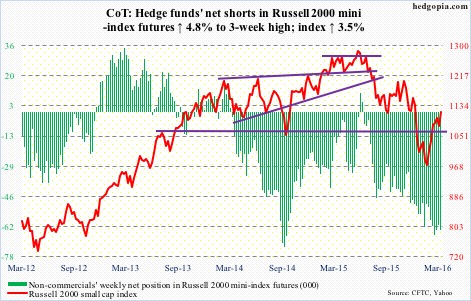
US Dollar Index: Reading between the lines in the afore-mentioned speech, it was clear Ms. Yellen would like a lower dollar. At least near-term, she has gotten exactly that. From Monday’s close to Thursday’s intra-day low, the dollar index dropped 1.7 percent.
Longer-term trends are probably going her way as well. Monthly momentum indicators have turned down, with a fresh MACD bearish crossover.
The issue is what is likely to happen near-term.
The 1.6-percent drop this week has dropped the dollar index right on a rising trend line from last May. On Thursday, it tested the lower Bollinger Band, before bouncing a tad. Friday produced a long-legged doji. The 10-day moving average is beginning to go flat.
In an imminent rally, 97 is where bulls and bears are set to lock horns. Besides horizontal resistance, this is where both 50- and 200-day moving averages converge, with a fresh death cross to boot.
Non-commercials’ net longs have gone flat the past three weeks.
Currently net long 17.8k, up 76.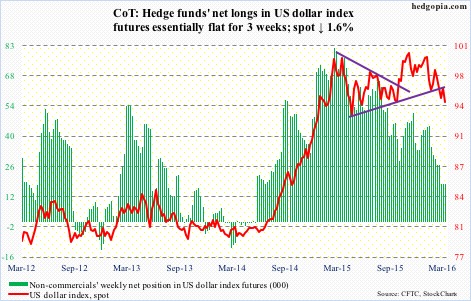
VIX: Not surprisingly, spot VIX got slammed on Tuesday from right underneath its 20-day moving average. Friday saw a repeat of that.
That said, a bullish MACD crossover looks imminent on a daily chart.
Two weeks ago, the VIX to VXV ratio dipped below 0.8 to .782. Last week was .807, and this week .794. The spring is coiled.
Currently net short 13.8k, up 9.8k.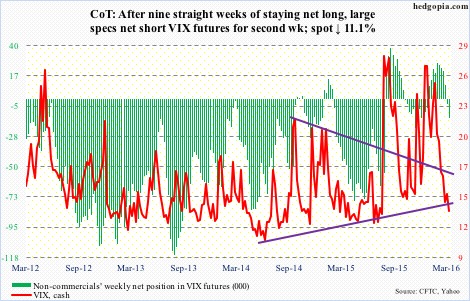
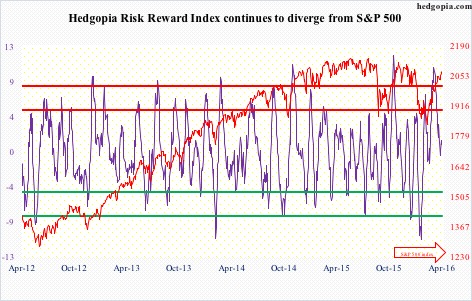
Hedgopia Risk Reward Index