The following are futures positions of non-commercials as of April 5, 2016. Change is week-over-week.
10-year note: The FOMC minutes for the March 15-16 meeting were released this week, and there was nothing substantially new.
That said, maybe because FOMC minutes tend to deal with issues at length, this one comes across as a little bit more dovish than the post-FOMC statement (released on March 16th.)
At the same time, they were not as uber-dovish as Janet Yellen’s, Fed chair, speech last Tuesday at the Economic Club of New York.
Either way, markets got confirmation that the Fed’s message has shifted from hawkish to dovish.
Nonetheless, non-commercials raised net shorts to a 22-week high. Rates do seem to want to go higher for now.
Currently net short 117.3k, up 100.4k.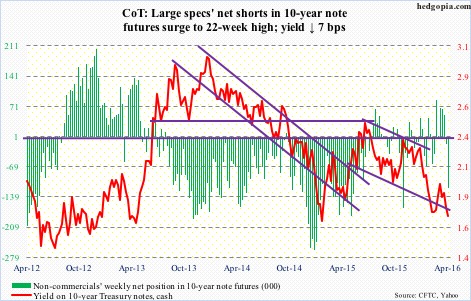
30-year bond: Major economic releases next week are as follows.
The NFIB optimism index for March comes out on Tuesday. February was 92.9, down a point month-over-month, and down from cycle high 100.3 in December 2014. Small businesses’ capex plans in February were 23, down from cycle high 29 in August 2014. Similarly, comp plans were 12 in February, down from 21 in December last year.
Wednesday brings PPI-FD and retail sales (both for March).
Producer prices fell 0.2 percent in February. In the 12 months through February, the PPI was unchanged. Core PPI rose 0.1 percent, and was up 0.9 percent in the 12 months through February.
February retail sales fell 0.2 percent m/m to a seasonally adjusted annual rate of $447.3 billion. On an annual basis, they rose 3.1 percent – the largest increase since 3.9 percent in January last year.
The CPI for March is published on Thursday. Consumer prices fell 0.2 percent in February. In the 12 months through February, they rose one percent. Core CPI was up 0.3 percent. On an annual basis, they increased 2.3 percent – fourth straight two-percent plus reading.
On Friday, we get industrial production (March), the University of Michigan’s consumer sentiment (preliminary April), and the Treasury International Capital (February).
On an annual basis, industrial production has dropped for four straight months. Capacity utilization was 76.7 percent in February, down year-over-year for 10 consecutive months. Utilization peaked at 79 percent in November 2014.
Consumer sentiment fell seven-tenths of a point in March to 91. The cycle high was reached in January 2015 at 98.1.
Foreigners have not been showing love for U.S. equities. On a 12-month rolling total basis, they sold $127 billion worth of equities in January – a record.
Six FOMC members are scheduled to speak during weekdays.
Currently net long 53.7k, down 6.2k.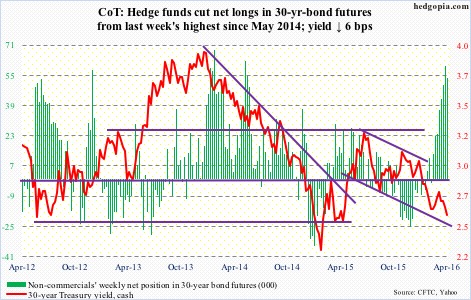
Crude oil: Fortunes flipped, so to speak.
For the week ended last Friday, crude stocks fell in the U.S., while gasoline and distillate stocks rose.
For the first time in eight weeks, crude inventory declined – by 4.9 million barrels to 529.9 million barrels. The prior week was the highest since the all-time high in 1929. In the past 13 weeks, stocks have gone up by 47.6 million barrels.
In the meantime, gasoline stocks rose by 1.4 million barrels to 244 million barrels. Prior to this, stocks declined by 16.1 million barrels in six weeks. Similarly, distillate stocks increased by 1.8 million barrels to 163 million barrels.
Crude production, too, fell by 14,000 barrels per day to nine million barrels per day. Production reached a record 9.61 mb/d in the June 5th (2015) week.
Crude imports continued to fall, this time by 494 kb/d to 7.3 mb/d. In the past couple of weeks, imports have fallen by 1.1 mbpd, but from a high level.
Lastly, refinery utilization rose by a point to 91.4. Utilization has increased 5.3 points in the past eight weeks.
As stated last week, support at $34.50-$35 was a line in the sand. It held this week, with an increase in volume. There is room to rally on a daily chart.
The only potential problem is the U.S. dollar. The U.S. dollar index is itching to rally – at least near term.
Currently net long 293.3k, down 8.7k.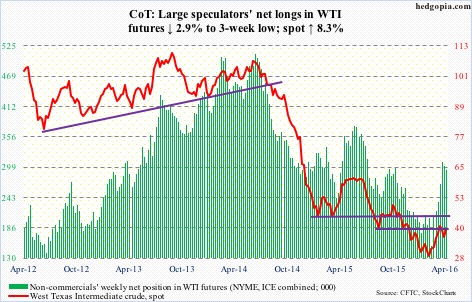
E-mini S&P 500: For the first time since February 24th, the index this Thursday fell below its 20-day moving average, albeit only slightly. The 10-day moving average is flat. Momentum is weakening, with a fresh daily bearish MACD crossover.
The S&P 500 fell 1.2 percent for the week, retreating from a declining trend line from last July.
As the 1Q15 earnings season begins, buybacks – for now – no longer act as a tailwind. This, even as inflows have been a persistent problem.
The current rally started on February 11th. Since the week ended February 10th, $7.3 billion has left U.S.-based equity funds (courtesy of Lipper). In the latest week ended Wednesday, $3.2 billion came into these funds, but the last time there were two straight weeks of inflows was in early November last year.
Here is another perspective. To many investors, on March 16th, at the end of a two-day FOMC meeting, the Fed apparently gave an “all-clear” signal to stocks when it switched from hawkish to dovish message. Is retail buying this? At least not yet. U.S.-based equity funds attracted a mere $500 million since March 16th.
That said, in the week ended Wednesday, SPY, the SPDR S&P 500 ETF, attracted $1 billion, with a combined $3.5 billion on Monday and Tuesday (courtesy of ETF.com). These funds are now in the red.
Currently net short 104.2k, down 17.9k.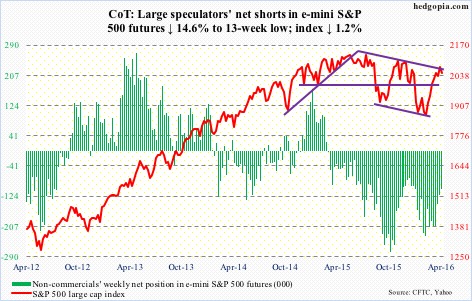
Euro: Since November last year, the euro has rallied eight-plus percent, and is once again knocking on resistance at 114.50, which goes back to January last year.
In the process, weekly momentum indicators are now in overbought territory. On a daily chart, signs of fatigue are appearing, with the currency hugging the 114 range the past seven sessions.
At least near term, the path of least resistance is down. This is technical in nature, not much to do with fundamentals. The latter has been a source of confusion, anyway. On March 10th, the European Central Bank announced uber-dovish stimulus measures, and the currency rallied 1.6 percent in that session, and another 2.3 percent since – for sure not what Mario Draghi, ECB president, was probably hoping for.
Currently net short 53.5k, down 10.3k.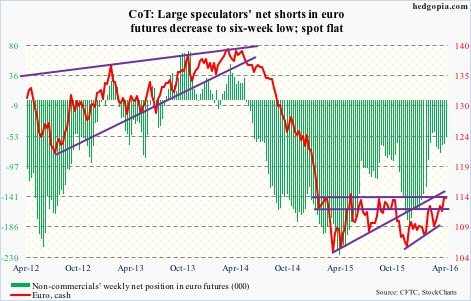
Gold: Gold bugs are not giving up easy.
Faced with a descending triangle formation on spot gold, the horizontal line of which lies at $1200-plus, they are fighting tooth and nail to nullify the bearish signal. So far, they have succeeded. If the pattern is complete, gold could be headed toward below its 200-day moving average ($1141). By that time, it would have not only lost its 50-day moving average but also six-plus year support at $1180.
Assuming the descending triangle is nullified, the next task gold bugs face is breaking out of the range gold is in.
The metal has been in a sideways pattern since it spiked 4.1 percent on February 11th. (That was when U.S. stocks bottomed.)
Here is the risk: Non-commercials’ net longs were 190,400 this week – comparable to holdings as of January 27, 2015 and November 27, 2012 (arrows in the chart). Both these dates marked major peaks – in both net longs and spot gold.
Currently net long 190.4k, up 594.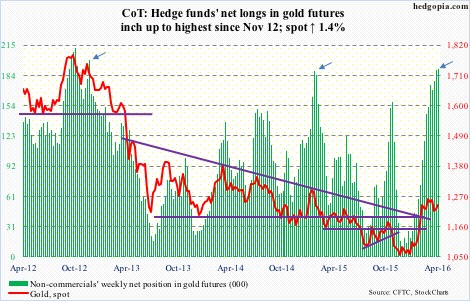
Nasdaq 100 index (mini): Lost 1.3 percent for the week, but remains above both its 200-day moving average (4419) and November 2014 horizontal support at 4350.
After remaining overbought for five weeks, daily momentum indicators are currently in process of unwinding. The question is, what happens when the index approaches the afore-mentioned support?
Flows continue to pose a question mark. In the week ended Wednesday, $307 million came out of QQQ, the PowerShares Nasdaq 1000 ETF. This followed $549 million in inflows in the prior week (courtesy of ETF.com).
Currently net long 29.3k, up 8.2k.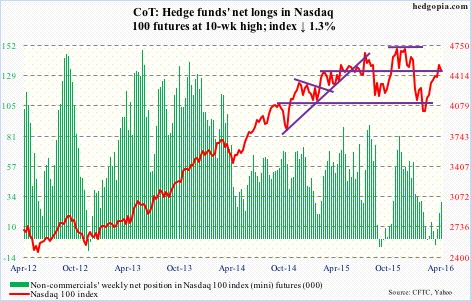
Russell 2000 mini-index: Just had a daily bearish MACD crossover, and the index is in process of unwinding daily overbought conditions.
Support at 1080 is 1.6 percent away. This has been a crucial area of duel between bulls and bears going back to September 2013. Most recently, it broke out of it on March 29th. And the bulls are already having to defend the breakout.
Non-commercials, although on the losing side of the trade since February 11th, never bought into the rally. Flows into IWM, the iShares Russell 2000 ETF, have really not cooperated. Since the week ended February 10th, the ETF has attracted a mere $650 million. In the week ended this Wednesday, $890 million was withdrawn.
Currently net short 63.4k, down 297.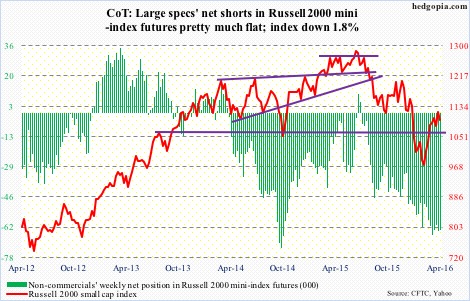
US Dollar Index: From December 3rd intra-day high through the low this Thursday, the dollar index lost 6.5 percent. Both daily and weekly momentum indicators are oversold.
Signs of exhaustion are also showing up on a daily chart, with the index having produced several doji sessions the past several sessions. It is itching to move higher. The question is of duration.
Overhead resistance is strong – particularly around 97, which is where the 200-day moving average lies as well (97.07). The 50-day moving average (96.52) continues to drop.
It just feels like non-commercials are patiently waiting before making a big decision. Net longs have gone flat the past four weeks.
Currently net long 17.3k, down 435.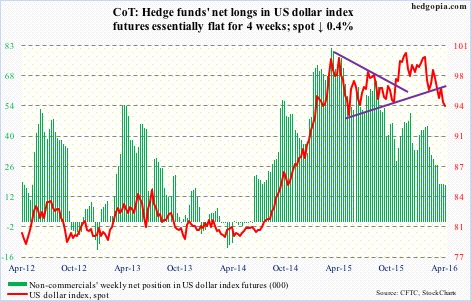
VIX: On April 1st, spot VIX had a daily bullish MACD crossover. VIX is higher since then, but progress has been spotty. A 10/20 (daily moving average) crossover is still possible, as VIX went sideways in the 13-14 region for nearly three weeks.
On a weekly basis, VIX – overbought – still has tons of unwinding left to do. It retreated from Thursday’s high of 16.77, but at the same time found support at its 20-day moving average on Friday. There were two daily dojis in the week.
Three weeks ago, the VIX-to-VXV ratio dropped to 0.782 – a one-year low – and has started moving up, but has ways to go before making it to overbought zone.
Currently net short 34.2k, up 20.5k.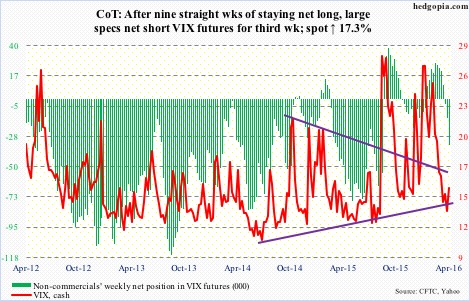
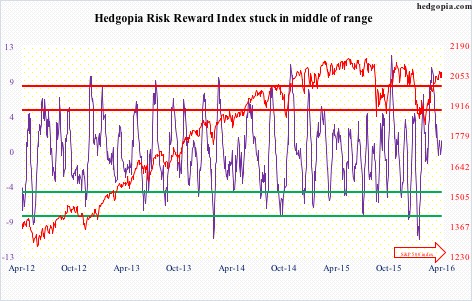
Hedgopia Risk Reward Index