The following are futures positions of non-commercials as of April 19, 2016. Change is week-over-week.
10-year note: That this is even being discussed in the press and among economists is a sign of how insane things have gotten in central banking.
On Thursday, in a post-governing council meeting press conference, Mario Draghi, ECB president, was asked about the likelihood of ‘helicopter money’ as a policy tool. In his last press conference, he did describe it as an “interesting concept.”
‘Helicopter money’ is a way of injecting cash directly into the economy. Under this, either budget deficits are permanently monetized, or central banks make direct transfers to the private sector, without fiscal involvement.
On Thursday, Mr. Draghi did say “The bottom line is, we have never discussed it.” But increasingly, ‘helicopter money’ is something we have been hearing more and more of these days.
Form zero interest-rate policy (ZIRP) to quantitative easing (QE) to negative interest-rate policy (NIRP), major central bankers have adopted all possible unconventional tools, yet miserably failed in their goal to stoke inflation, which is what they desperately need as debtor nations.
From the U.S. to the Eurozone to Japan to now China, debt load is simply too high. And ‘helicopter money’ is another “tool” that relies on trying to cure the ails of debt with more debt. Would not work.
Currently net short 24.3k, down 85.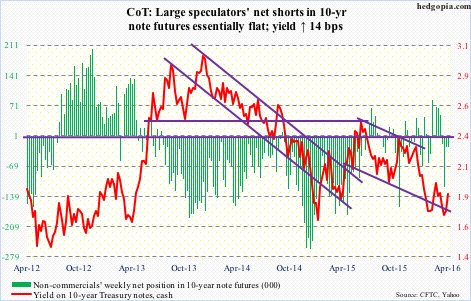
30-year bond: Major economic releases next week are as follows. It is a busy week.
March’s new home sales are published on Monday. February was up two percent to a seasonally adjusted annual rate of 512,000 units. Sales peaked at 545,000 in February last year, which was the highest since 593,000 in February 2008. The median price of a new home rose 2.6 percent year-over-year to $301,400. The all-time high of $317,000 was reached in November last year.
The FOMC begins a two-day meeting on Tuesday. There is no press conference scheduled for Janet Yellen, Fed chair.
Also on tap on Tuesday are durable goods orders (advance report for March), and the S&P Case-Shiller home price index (February).
In February, orders for non-defense capital goods ex-aircraft rose 0.7 percent y/y to a seasonally adjusted annual rate of $67 billion. This is the 13th straight annual decline in orders. They peaked at $74 billion in September 2014.
In January, the home price index (national) rose 5.4 percent annually. Price has been appreciating since it hit growth of 4.3 percent in February last year.
The Pending home sales index for March comes out on Wednesday. February rose 3.7 points month-over-month to 109.1. The cycle high was reached last April at 111.2 – a five-year high. This series correlates well with existing home sales.
Thursday brings the advance estimate of 1Q16 GDP. The Street expects 1.3-percent real GDP growth. However, the Atlanta Fed’s GDPNow model is only forecasting 0.3-percent growth (as of April 19th).
On Friday, personal income (March), employment cost index (1Q16), and the University of Michigan’s consumer sentiment (final April) are reported.
In the personal income report, all eyes will be focused on core PCE – the Fed’s favorite measure of consumer inflation. The 1.68-percent annual change in February was below the Fed’s two percent goal. That said, inflation has been perking up since the 1.26-percent rise last July.
In 4Q15, compensation costs for private industry workers increased 1.9 percent annually, slower than the 2.3-percent rise in 4Q14.
April’s preliminary reading showed consumer sentiment slipped 1.3 points m/m to 89.7. Sentiment peaked at 98.1 in January 2015 – an 11-year high.
Only one FOMC member – Rob Kaplan – is scheduled to speak during weekdays (on Friday).
Currently net long 53k, down 2.9k.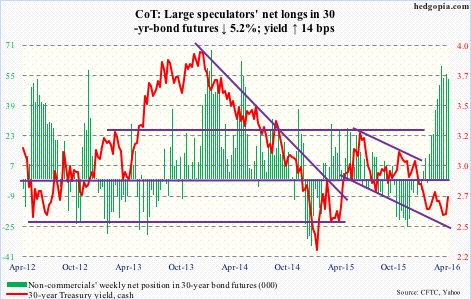
Crude oil: At least in the U.S., the divergence between crude and gasoline stocks continues.
For the week ended April 15th, crude inventory rose by another 2.1 million barrels to 538.6 million barrels. In the past 15 weeks, stocks have gone up by 56.3 million barrels. Stocks are inching ever closer to the all-time high 545 million barrels in 1929.
Gasoline stocks, on the other hand, fell by another 110,000 barrels to 239.7 million barrels. Stocks have gone down by 19 million barrels in the past nine weeks.
Other positives included distillate inventory, which fell 3.6 million barrels to 159.9 million barrels, and crude production, which stayed below nine million barrels per day for a second week, dropping 24,000 b/d to 8.95 mb/d. Production peaked at 9.61 mb/d in the June 5th week last year, so has declined by more than 600,000 b/d. Further, refinery utilization inched up two-tenths of a percent to 89.4 percent.
On the negative column were crude imports, which increased 247,000 b/d to 8.2 mb/d.
Markets continue to be in a mood of clinging on to the positives and giving the cold shoulder to the negatives.
Spot West Texas Intermediate crude added another 4.8 percent this week – its third consecutive up week. Since April 5th when it successfully defended breakout support at $34.50-$35 through the Thursday intra-day high, it rallied 26 percent.
With this, the WTI sits right at resistance at $43.50 that goes back to January last year, and, in fact, can be extended to even July 2004. Needlessly to say, a breakout here would be a massive technical win for the bulls.
In the event of a breakout, given the run it has had since February 11th and the overbought conditions it is in, whether or not it will stick is a different matter altogether.
Currently net long 326.3k, up 32.7k.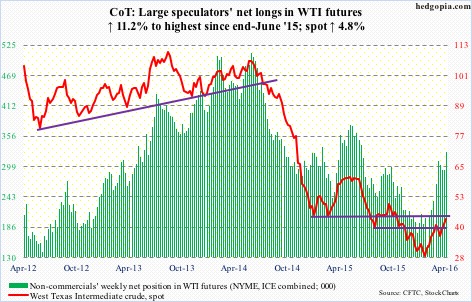
E-mini S&P 500: On Monday, the S&P 500 rallied 0.7 percent after successfully retesting last week’s mini break out of 2075. That same session, $4.6 billion was withdrawn from SPY, the SPDR S&P 500 ETF (courtesy of ETF.com). For the week ended Wednesday, $2.9 billion left. This was on the heels of $1.3 billion in inflows in the prior week.
Arguably, money left on Monday while the going was good. But the same argument could have been made pretty much throughout this rally.
Since February 10th, $16.6 billion has come out of U.S.-based equity funds (courtesy of Lipper), yet the S&P 500 has rallied nearly 17 percent from the February 11th bottom.
Incidentally, for whatever it is worth, on the S&P 500 a mere two points separate the 50- and 200-day moving averages. With the 50-day rapidly rising and the 200-day flattish, a golden cross is imminent. Remains to be seen if this will mean anything for the index. The last golden cross occurred just a few sessions before the index peaked in late December last year.
For now, Wednesday produced a daily doji just outside the upper Bollinger Band – a sign of exhaustion at least near term. That said, early Friday weakness was bought near the rising 10-day moving average, with tons of broken resistance-turned-support underneath.
Squeeze fuel is running dry, as non-commercials cut net shorts to the lowest since June last year.
Currently net short 65.9k, down 23.5k.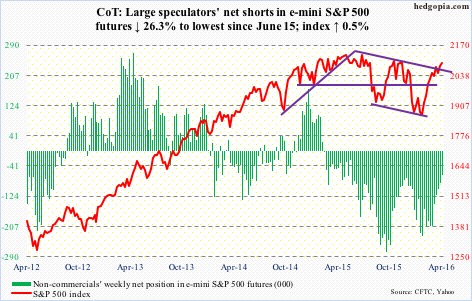
Euro: Resistance at 114-114.50, which goes back to January last year, has held – at least so far. After unsuccessfully trying to break out for three consecutive weeks, the euro once again had a feeble shot at that ceiling this week, but to no avail.
The European Central Bank’s governing council meeting this week, or Mario Draghi, ECB president, for that matter, was no help.
The deposit rate on lenders’ reserves parked at the central bank was kept at minus 0.4 percent. Mr. Draghi’s oft-repeated ‘all policy tools remain on the table’ did not excite the markets.
Post-meeting on Thursday, the euro at one point was up 0.9 percent to 113.97 before giving back the gains and falling back to 112.86, down 0.1 percent for the session. Come Friday, it shed another 0.5 percent.
Weekly indicators seem to be rolling over, with plenty of room for the currency to drop. The 50-day moving average (111.9) is flattening/dropping slightly.
Currently net short 46.9k, down 5.1k.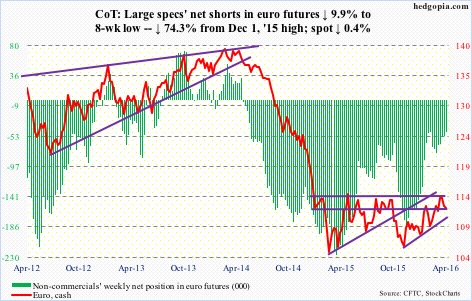
Gold: Kudos to gold bugs for negating a fortnight ago a budding descending triangle pattern on spot gold. Concurrently, the 50-day moving average was defended as well. As a matter of fact, since April 1st, the metal has pretty much followed the average higher. That changed Friday, when the spot lost 1.3 percent, and the 50-day as well.
On Thursday, it rallied all the way up to 1272.4 before closing at 1249.5, producing a not-so-good-looking candle. The Thursday high approximated the top end of the range it is in.
As far as flows go, GLD, the SPDR gold ETF, lost $206.8 million in the week ended Wednesday. This comes on the heels of $381 million in outflows in the prior week.
That said, non-commercials continue to exude confidence, with net longs rising to the highest since August 2011. The problem is, gold has lost ground in the past couple of weeks – although ever so slightly.
Currently net long 216.8k, up 3k.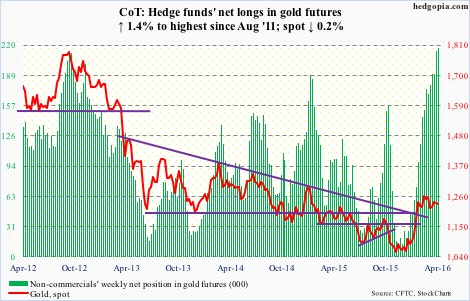
Nasdaq 100 index (mini): In the six sessions through Thursday, there were three doji sessions on the Nasdaq 100, essentially hugging the 10-day moving average. That got taken out Friday, reacting to disappointing earnings from Alphabet (GOOGL) and Microsoft (MSFT), among others; the session, down 1.5 percent, produced another long-legged doji.
The good thing is, until Friday the index was holding up just fine despite $643.1 million coming out of QQQ, the PowerShares Nasdaq 1000 ETF, in the week ended Wednesday.
There are tons of support underneath, with the 200-day moving average at 4423 and the 50-day at 4369. The latter also approximates horizontal support at 4350 going back to November 2014.
Currently net long 50.5k, up 12.4k.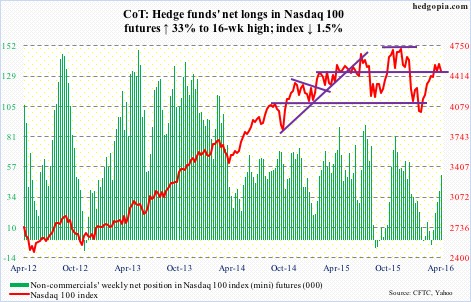
Russell 2000 mini-index: After remaining right underneath the 200-day moving average for three straight sessions last week, the Russell 2000 broke out of it on Monday. Interestingly, the index was also able to feebly break out of a declining trend line from last June. Flows helped.
IWM, the iShares Russell 2000 ETF, attracted $240.4 million in the week ended Wednesday (courtesy of ETF.com). A convincing break out of this trend line would be a major win for the bulls, but it is anything but – particularly so considering how overbought conditions are.
Currently net short 56.8k, down 10k.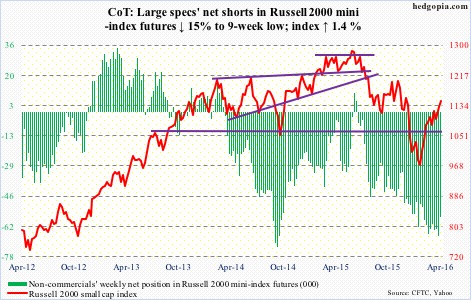
US Dollar Index: Since the dollar index reached an eight-month low of 93.62 on April 12th, it essentially went sideways, enabling shorter-term moving averages to flatten out. Then a Thursday hammer set up a 0.5-percent rally on Friday.
The weekly chart is itching to move higher. Overhead resistance is strong – particularly around 97, which is where the 200-day moving average lies as well (97). The 50-day moving average (95.9) is beginning to go flat.
It will be interesting to see if action on Wednesday through Friday tempted non-commercials to add to net longs. As of Tuesday, holdings were at a 10-month low.
Currently net long 13.4k, down 400.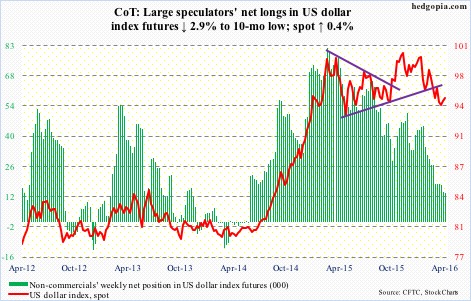
VIX: On Wednesday, for the first time since October 28th, spot VIX dropped below 13. Both were hammer sessions and both tagged the lower Bollinger Band. Back then, VIX went on to quickly rally to north of 20 in the next 13 sessions. The odds of a similar performance by VIX this time around? Pretty good. VIX remains oversold – now on a weekly chart as well.
Similarly, in four of the past six weeks, the VIX-to-VXV ratio has been sub-0.80, with the March 14th week producing a reading of 0.782 – a one-year low. The other two weeks are in the low 0.80s. This is too low a reading for too long a duration.
Currently net short 59.4k, up 19.1k.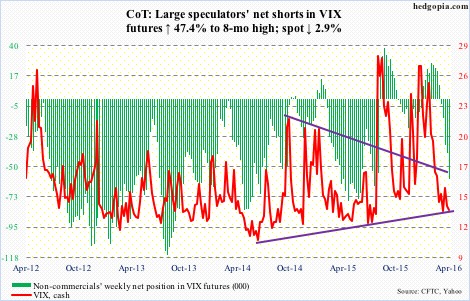
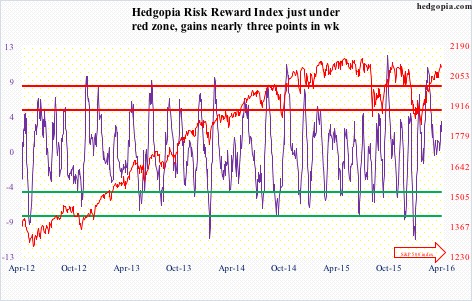
Hedgopia Risk Reward Index