The following are futures positions of non-commercials as of June 28, 2016. Change is week-over-week.
10-year note: On Friday last week and Monday this week, the S&P 500 index lost 5.3 percent, the 10-year Treasury yield lost 29 basis points to 1.46 percent. Tuesday through Friday, the S&P 500 rallied 5.1 percent, with 10-year yields essentially unchanged. The bond market still thinks Brexit is a concern, stocks have decided to move on.
On Friday, 10-year yields fell to an intra-day low of 1.41 percent – not that far away from the all-time low of 1.39 percent in July 2012. How long before that low gets taken out?
Demand for government bonds – both here and abroad – remains heavy, and it is hard to imagine this changing anytime soon.
Currently net long 83.9k, down 30.7k.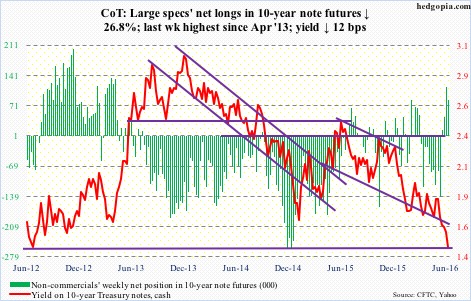
30-year bond: Major economic releases next week are as follows. Happy Independence Day! Markets are closed on Monday.
May’s durable goods were reported on June 24th. Revised and more detailed estimates will be reported on Tuesday. Orders for non-defense capital goods ex-aircraft – proxy for business capex – were down 0.7 percent in May to a seasonally adjusted annual rate of $62.4 billion. This was the second straight month-over-month drop. On a year-over-year basis, orders fell 3.6 percent, for a 7th consecutive drop and 16th out of last 17 months.
Wednesday brings the ISM non-manufacturing index (June), and FOMC minutes for the June 14-15 meeting.
Services activity declined 2.8 points m/m in May to 52.9. The non-manufacturing index has decelerated from 59.6 last July. Similarly, orders fell 5.7 points m/m to 54.2 in May. That said, services are faring better than manufacturing.
June’s employment report is published on Friday. May was a big negative surprise, with the economy only adding 38,000 non-farm payroll jobs. The January-May monthly average this year is 150,000, which is substantially less than the 2015 monthly average of 219,000, and the 2014 average of 251,000. Momentum is in deceleration.
Three FOMC members have scheduled appearances on weekdays.
Currently net long 66k, down 37.5k.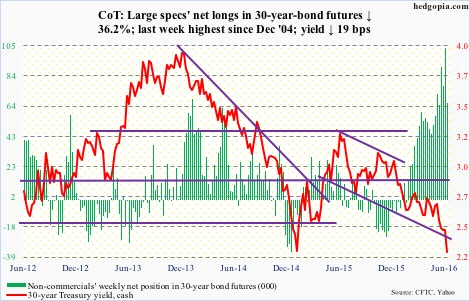
Crude oil: Quick return of risk-on attitude among traders and better news on U.S. crude stockpiles helped spot West Texas Intermediate crude rally 3.6 percent in the week.
In the week ended June 24th, stocks fell by 4.1 million barrels to 526.6 million barrels. They are now down 16.8 million barrels from the April 29th high of 543.4 million barrels, which was the highest since the all-time high 545.2 million barrels in October 1929.
Distillate inventory shrank by 1.8 million barrels to 150.5 million barrels. Stocks have declined 15 million barrels in the past 25 weeks.
Gasoline stocks, however, saw an increase of 1.4 million barrels to 239 million barrels.
U.S. production continues to drop, down another 55,000 barrels per day to 8.6 million b/d. Production peaked at 9.61 mb/d in the June 5th week last year.
Crude imports declined 884,000 b/d to 7.6 mb/d. The prior week was the highest since October 2012.
Refinery utilization rose, too, up 1.7 percentage points to 93 percent – a 29-week high.
As things stand now, the best spot WTI could achieve near term is rally to the June 9th high of $51.67/barrel. It remains overbought on the weekly chart, with sideways action the past seven weeks.
Currently net long 319.3k, down 3.9k.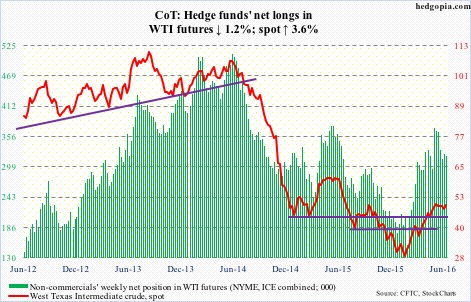
E-mini S&P 500: Bulls put foot down where they could possibly have. Support at 1990 stretches back to July 2014, and was vigorously defended on Monday. Off the Monday low, in the next four sessions, the S&P 500 rallied 5.6 percent. The post-Brexit two-day sell-off was 5.3 percent.
There is a weekly hammer on the chart – similar to August last year and January this year. Back then, after the initial trough, and the subsequent rally, those lows were successfully tested in September and February, producing another hammer reversal. The rallies that followed were massive on both occasions. Will the S&P 500 follow the same playbook this time around? Remains to be seen.
For now, in the week ended Wednesday, another $6.8 billion left U.S.-based equity funds. From the week ended February 10th, $60 billion has been redeemed (courtesy of Lipper).
During the same week, SPY, the SPDR S&P 500 ETF, lost $7.7 billion (courtesy of ETF.com), with Tuesday and Wednesday in which the index rallied four percent unable to attract funds, losing $2.8 billion.
Currently net long 61.9k, up 7.1k.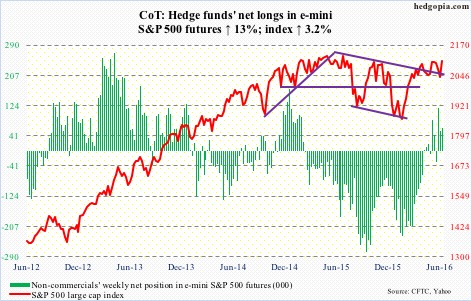
Euro: Eurozone consumer inflation crawled out of negative territory in June. This was a first estimate for the month. Prices rose 0.1 percent, after slipping by the same amount in May. Not much to write home about. The ECB has a target of close to two percent, has pushed benchmark interest rates into negative territory, and grown its balance sheet from €2.04 trillion in September 2014 to €3.08 trillion in May this year. Inflation is a no-show.
The euro tried to stabilize this week, but was nowhere near recouping post-Brexit losses. Has room to rally near term.
Currently net short 61.9k, up 588.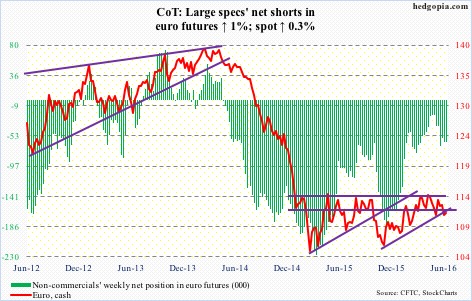
Gold: Money continued to flow into GLD, the SPDR gold ETF. Another $1.4 billion made it into the ETF in the week ended Wednesday. This followed inflows of $629 million in the prior week.
For the week, spot gold rallied another two percent – fifth consecutive up week.
Last week’s high $1,362.6 nearly tested $1,381, which is a 38.2-percent Fibonacci retracement of the decline between September 2011 and December 2015.
If for whatever reason the metal comes under pressure, it has carved out another support zone in the $1,260 area, which it broke out of in June after four months of consolidation.
For now, non-commercials are not expecting a sizable pullback. Net longs rose to another record.
Currently net long 301.9k, up 9.2k.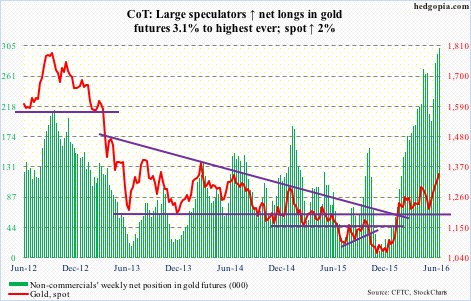
Nasdaq 100 index (mini): No sooner 4350 was lost than was recaptured. This support/resistance goes back to November 2014. In fact, buyers showed up Thursday near that level before pushing the index up 1.2 percent.
The index has made lower highs since last November, and ‘lower highs, lower lows’ since April. It will break out of the pattern around 4500, which is 63 points away. Flows probably need to improve for that to happen.
In the week ended Wednesday, QQQ, the PowerShares Nasdaq 100 ETF, lost $701 million (courtesy of ETF.com).
Currently net long 46.8k, down 29.8k.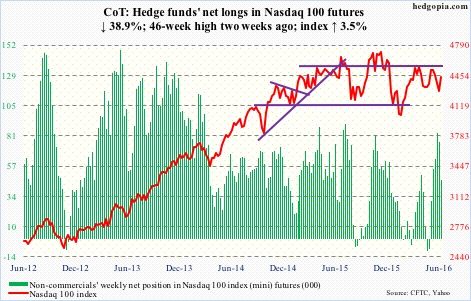
Russell 2000 mini-index: Post-Brexit loss of 50- and 200-day moving averages was recaptured in no time. That said, as is the case with other indices, the Russell 2000 remains below pre-Brexit high. For the week, small-caps also rallied less than other major indices.
In the week ended Wednesday, IWM, the iShares Russell 2000 ETF, lost $770 million, with outflows of $626 million on Tuesday and Wednesday. The index rallied 3.9 percent in those two sessions. At least until Wednesday, there were plenty of doubters if the rally would stand.
Currently net short 34.3k, up 15.1k.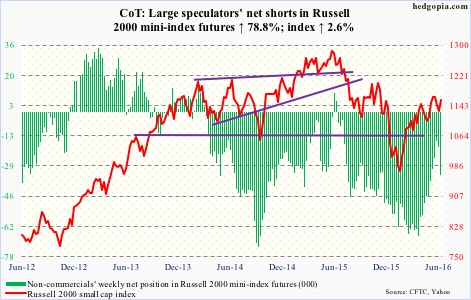
US Dollar Index: From last week’s Thursday close through this Monday, the US dollar index jumped 3.4 percent. This was the sharpest two-session increase since it rallied 3.6 percent on September 29, 1992.
Even after this surge, the dollar index is stuck in the middle of a 15-month range. Last Thursday, it dropped all the way to 93.03 to test the lower bound of that range before reversing with a hammer. The subsequent two-day rally had it break out of a seven-month declining channel.
It is all fear-driven, not fundamentals.
In recent sessions, the dollar index has diverged from two-year Treasury yields. The latter tends to be sensitive to the Fed’s monetary policy forecasts. Rate-hike odds have tumbled.
That said, non-commercials did react to Brexit by slightly adding to net longs, which were at two-year lows two weeks ago.
Currently net long 12.2k, up 2.8k.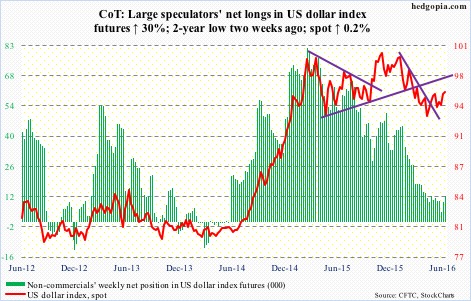
VIX: On Monday, the S&P 500 lost 1.8 percent, following a 3.6-percent drop last Friday. In that session, spot VIX briefly surpassed last Friday’s high, then sold off hard. In the end, it shed nearly two points. This on a down day for the S&P 500! That was a tell. Tuesday through Friday, the S&P 500 rallied 5.1 percent, and spot VIX gave back north of 12 points from Monday’s intra-day high.
As well, the VIX-to-VXV ratio last Friday jumped to 1.076 – way overbought. This week, it ended at 0.837. Ideally, there is still some room for unwinding, but is just about done. The ratio’s surge preceded weeks of readings in high 0.70s/low 0.80s.
Currently net short 50.1k, up 4.5k.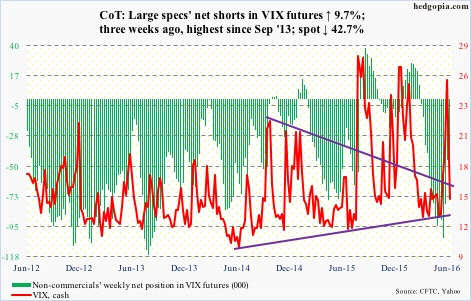
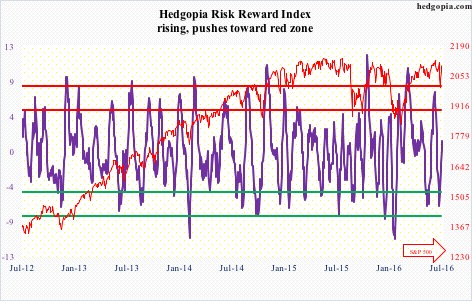
Hedgopia Risk Reward Index