The following are futures positions of non-commercials as of October 25, 2016.
10-year note: Rates are rising. From 1.34 percent on July 6 this year to 1.88 percent on Friday, the 10-year Treasury yield has come a long way. In a larger scheme of things, this is nothing. It is still in a long-term downtrend. At the same time, a 54-basis-point rise in three months is nothing to sneeze at.
When yields fell to the July low, technicals on all timeframes were grossly oversold. So the sell-off in the long end of the curve could merely be an unwinding of these conditions.
But what if it is more than that? What if markets are fearing – thus voting with their money – an exit by major central banks from hitherto ultra-easy monetary policy?
As things stand, markets are pricing in high probability of a hike by the Fed in the December 13-14 meeting. Rates are still near zero, but this will be the second hike in a year, and could potentially be a signal.
Across the Atlantic, the ECB refuses to commit to an extension of its €80-billion/month asset purchase program beyond next March. And across the Pacific, the BoJ has shifted its policy from expanding the money supply to controlling interest rates.
This could very well be early signs of what is to come.
That said, this scenario is not yet supported by/reflected in equities, which are holding up. This would change once equities start fearing less liquidity from central banks.
Currently net long 74.5k, down 25.4k.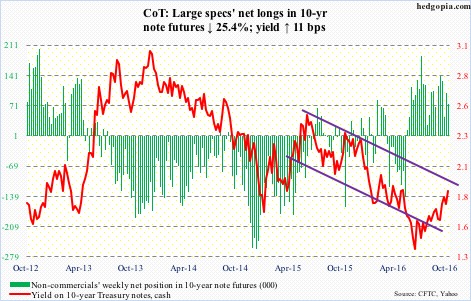
30-year bond: Major economic releases next week are as follows.
Monday brings September’s personal income and outlays. Core PCE – the Fed’s favorite measure of consumer inflation – rose 1.69 percent year-over-year in August. This was the fastest growth rate since the low of 1.31 percent in July last year. The last time core PCE rose at a two-percent clip was in April 2012.
October’s ISM manufacturing index is published on Tuesday. September rose 2.1 points month-over-month to 51.5. Orders jumped six points m/m to 55.1.
FOMC meeting begins on Tuesday, and ends the next day. There is one more meeting left this year – on December 13-14.
Productivity (3Q16), durable goods (September, final), and ISM non-manufacturing (October) come out on Thursday.
Non-farm business output per hour fell at a 0.6-percent annual rate in 2Q16. This was the third consecutive negative quarter. Productivity fell 0.4 percent y/y – the first negative quarter in three years.
Orders for non-defense capital goods ex-aircraft – proxy for business capex – dropped 1.2 percent m/m to a seasonally adjusted annual rate of $62.9 billion. Orders fell 4.1 percent y/y. This was the 20th y/y drop in the last 21 months. Orders peaked at $70.7 billion in September 2014.
The non-manufacturing index increased 5.7 points m/m in September to 57.1, while orders jumped 8.6 points m/m to 60.
October’s employment report is reported on Friday. September produced 156,000 non-farm jobs, lower than the 2016-to-date average of 178,000, which in itself is slower than the monthly average of 229,000 in 2015 and 251,000 in 2014.
Two FOMC members are scheduled to speak on weekdays.
Currently net long 4.5k, up 1.1k.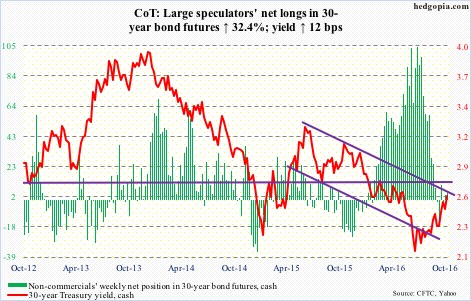
Crude oil: In the weekly EIA report, the inventory data was favorable but oil was unable to rally, with spot West Texas Intermediate crude dropping 1.6 percent on Wednesday.
Earlier on Sunday, Iraq said it does not want to join OPEC output cut, if there is one, which will be decided at its November 30th meeting. Iraq said it currently produced 4.77 million barrels per day, of which 3.87 mb/d was exported. The Iraqi news already put oil under pressure. Then there were technicals.
Since the February lows, spot WTI has been making higher lows, and would have been an interesting development had it convincingly pushed past the June 9th high of $51.67 for higher highs. On October 19, the spot did rise to $52.22 but the momentum did not last very long. Weekly momentum indicators are now coming under pressure. The February trend line comes up for a retest around $46.
In the week through October 21, crude stocks fell by 553,000 barrels to 468.2 million barrels. This was the lowest since January 22 this year. Crude stocks have dropped by 27.1 million barrels in the last eight weeks.
Gasoline stocks dropped by two million barrels to 226 million barrels, and distillate stocks by 3.4 million barrels to 152.4 million barrels – an 11-week low.
Crude imports, on the other hand, rose by 109,000 b/d to seven mb/d. The prior week was the lowest since June 19, 2015.
Crude production increased by 40,000 b/d to 8.5 mb/d – a five-week high. Production peaked at 9.61 mb/d in the June 5th week last year.
And refinery utilization inched up six-tenths of a point to 85.6. The prior week was the lowest since April 26, 2013.
Currently net long 363.9k, down 14.5k.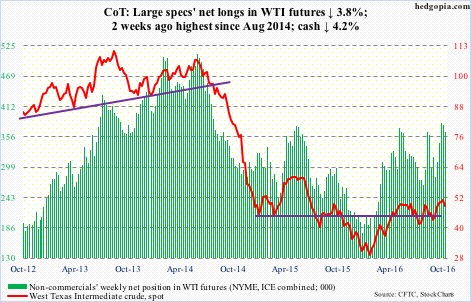
E-mini S&P 500: The rising trend line from February this year on the S&P 500 (cash) has been slightly breached, with a failed backtest this week. The 50-day moving average continues to drop. SPY, the SPDR S&P 500 ETF, was repelled right at that average on Monday.
For the most part, post-earnings stock reactions have not been good, partly because of poor outlook and partly because stocks have had a great run into earnings. The October 13th low of 2115 – or horizontal support at 2120 – continues to be the line in the sand. The latter was tested on Friday.
In the week ended Wednesday, a whopping $16.6 billion came out of U.S.-based equity funds (courtesy of Lipper).
In the same week, SPY attracted $1.3 billion. This followed redemptions of $2 billion in the prior two (courtesy of ETF.com).
Currently net short 21.5k, down 44.5k.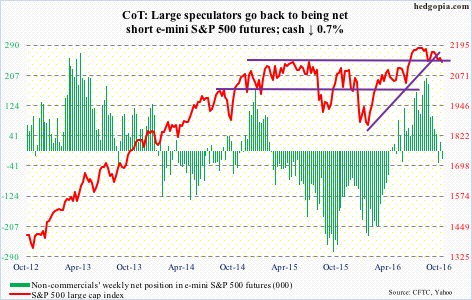
Euro: The IHS Market purchasing managers’ index for the Eurozone for October rose 1.1 points m/m to 53.7. Germany saw strong momentum, while France saw a slowdown. The usual saga.
Two weeks ago, the euro (cash) lost the November 2015 rising trend line. Since May this year, it has been making lower highs, and now has lower lows in place.
That said, the currency is trying hard to put its foot down. There is room for a rally on a daily chart. Resistance at 109.5, which repelled rally attempts on Wednesday and Thursday, was won over on Friday.
Currently net short 123.9k, up 14.6k.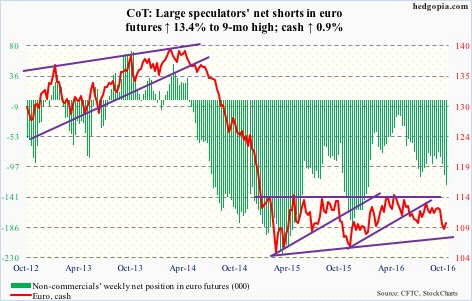
Gold: After the 3.3-percent October 4th drop through $1,300 support, spot gold has pretty much traded around its 200-day moving average ($1,269). The yellow metal has been on slight uptrend since October 7, but has been unable to substantially lift off of the average, which, unlike the 50-day, is still rising.
Flows are not cooperating. In the week ended Wednesday, GLD, the SPDR gold ETF, lost $1 billion. This followed $791 million in inflows in the prior couple of weeks (courtesy of ETF.com).
Non-commercials, who have cut back from the all-time high 315,963 contracts as of July 5, 2016 to last week’s 179,618, added some this week.
Currently net long 197k, up 17.4k.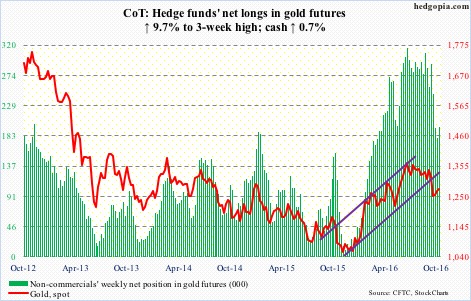
Nasdaq 100 index (mini): The Nasdaq 100 index scored a new all-time high of 4911.76 on Tuesday before coming under pressure. No new high for the Nasdaq composite, however.
Within tech, large-caps have been leading. Apple (AAPL), Alphabet (GOOGL), Microsoft (MSFT), Amazon (AMZN) and Facebook (FB) comprise the five largest companies today, with GOOGL, MSFT and FB rising to new highs on Tuesday. They are doing all the heavy-lifting, and are way extended. Support at 4840 on the Nasdaq 100 (cash) – as well as the 50-day moving average – was lost on Friday.
In the week through Wednesday, QQQ, the PowerShares Nasdaq 100 ETF, attracted $1.7 billion, (courtesy of ETF.com). For the week, the Nasdaq 100 fell one percent.
Since August 15 this year, the index has essentially gone sideways. Non-commercials’ net longs have risen from 127,946 as of August 16 to a record 162,662 this week. The risk going forward is if and when these traders grow impatient and start cutting back.
Currently net long 162.7k, up 5.5k.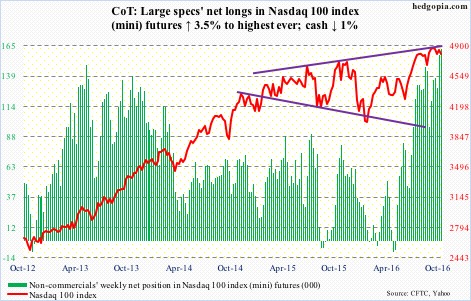
Russell 2000 mini-index: The 1200 support on the cash was once again tested this week, and lost. This has been an important price point for both bulls and bears going back to March 2014.
In the week ended Wednesday, IWM, the iShares Russell 2000 ETF, lost $853 million. This followed inflows of $1.4 billion in the prior week (courtesy of ETF.com).
Currently net long 6.3k, down 1.8k.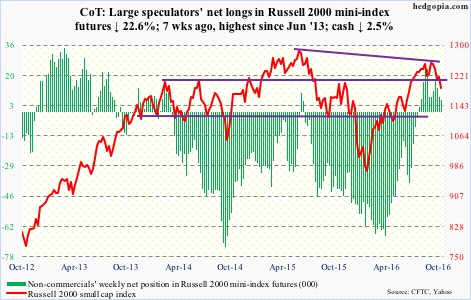
US Dollar Index: Since the early-May (2016) low, the cash has been trading within an ascending channel, the upper end of which is currently being tested.
The index remains grossly overbought particularly on a daily and weekly basis. Unwinding of these conditions is just a matter of time. This week probably begins that process.
In a larger scheme of things, the cash (rose to 99.09 on Tuesday, closing the week at 98.22) continues to trade within $100-plus and $93-plus. As is, it is hard to imagine a break to the upside anytime soon.
Currently net long 54k, up 8.6k.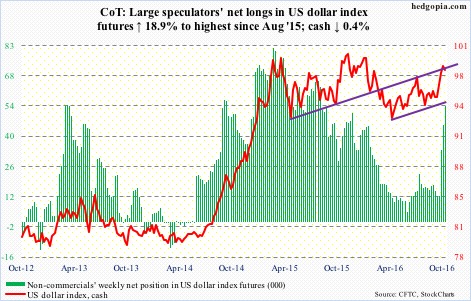
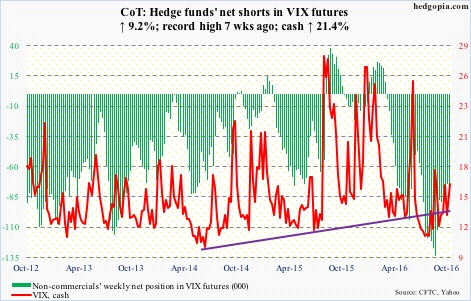
VIX: On Friday last week, spot VIX lost the 50-day moving average, but a subsequent test this Tuesday of the August 9th rising trend line was successful, as VIX dropped to 12.73. At 16.19, it is now back above that average, as well as the 200-day – albeit barely on the latter.
Intra-day Monday, the VIX-to-VXV ratio dropped to .834 before rising. The week closed at .93, and there is still some room for it to push higher.
Currently net short 81.5k, up 6.9k.