
Following futures positions of non-commercials are as of March 14, 2017.
10-year note: Currently net short 194.4k, down 104.1k.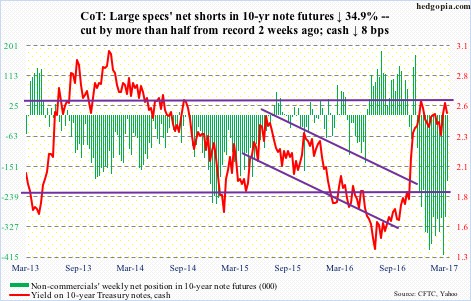
Equities up. Gold up. The US dollar index down. Ten-year Treasury yields down. This is how markets reacted to Wednesday’s FOMC decision to raise the fed funds rate to a target range of 0.75 percent to one percent. Since December 2015 – which was the first hike since June 2006 – rates have now gone up by 75 basis points – but remain sub-one percent.
The latest hike was well-telegraphed. In fact, responding to a well-coordinated jawboning by several FOMC members, markets went from 30-plus-percent odds of a hike this week to 100 percent in a matter of a few days. This probably also led them to believe that the Fed was on its way to becoming much more hawkish.
That was not the case – at least that is how markets are interpreting it. The dot plot continues to indicate three hikes this year. Hence the rally in equities, etc.
That said, there were some subtle changes in the statement. It said the Fed “expects that economic conditions will evolve in a manner that will warrant gradual increases in the federal funds rate.” Prior statements said “only gradual increases.” Arguably, this gives them some leeway if they wanted to get more aggressive.
Thus far, the long end is not cooperating. The 10-year was unable to break out of 2.6 percent – goes back to February 2009. Since the December 2016 hike, the yield curve has flattened.
At some point, the Fed has to make a choice – either continue to let asset inflation continue (stocks, real estate, etc.) or ignore the bond market and get aggressive. The latter in due course – as the long end of the curve fears – will negatively impact the economy. The Fed is cornered.
30-year bond: Currently net short 62.2k, up 19.4k.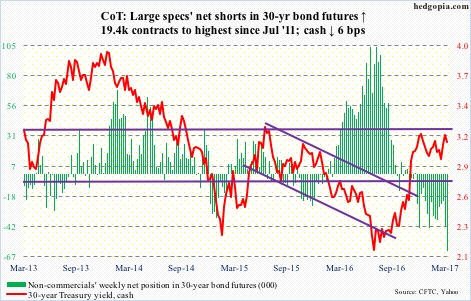
Major economic releases next week are as follows.
Existing home sales for February are due out on Wednesday. January was up 3.3 percent month-over-month to a seasonally adjusted annual rate of 5.69 million units – the highest since 5.79 million units in February 2007.
February’s new home sales are on tap for Thursday. Sales rose 3.7 percent m/m in January to 555,000 units (SAAR). Sales peaked at 622,000 last July; this was the highest since 627,000 in January 2008.
Friday brings February’s durable goods report. Orders for non-defense capital goods ex-aircraft – proxy for business capital expenditures – fell 0.1 percent in January m/m to $64.6 billion (SAAR), but rose 0.5 percent year-over-year. This was the second straight up month, preceded by y/y decline in the prior 13. Orders peaked at $70.7 billion in September 2014.
Crude oil: Currently net long 457k, down 75k.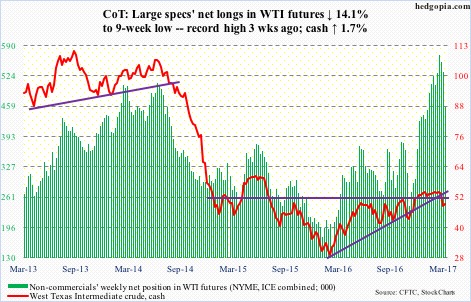
Spot West Texas Intermediate crude fell another 2.9 percent from last week’s close before buyers showed up Tuesday. Wednesday’s EIA report further helped sentiment. The daily chart was so oversold it probably would not take much to tempt dip buyers. And they showed up.
The crude rallied 1.7 percent for the week, and is back above the 200-day moving average – now no longer rising. Resistance is galore, including still-dropping shorter-term averages as well as the 50-day. The area of interest lies just north of $52, which was broken last week. The weekly chart has room to continue to head lower.
The latest EIA report showed crude stocks fell by 237,000 barrels to 528.2 million barrels. The prior week was a record.
Gasoline and distillate stocks continued to decline – down 3.1 million barrels and 4.2 million barrels to 246.3 million barrels and 157.3 million barrels, respectively. In the last four weeks, gasoline inventory dropped by 12.8 million barrels, and in the last five distillates by 13.4 million barrels.
Crude imports fell – by 745,000 barrels per day to 7.4 million b/d. Production, on the other hand, rose by 21,000 b/d to 9.1 mb/d. And refinery utilization fell eight-tenths of a point to 85.1 percent.
E-mini S&P 500: Currently net long 161.9k, up 24.2k.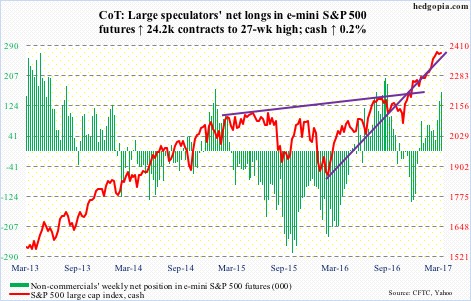
U.S.-based equity funds continue to attract money. In the week ended Wednesday, another $890 million came in. In the last seven weeks, they took in $47.1 billion, $16.6 billion in the last three (courtesy of Lipper). Notably, the S&P 500 (cash) has been under slight pressure since it gapped up to a new all-time high 2400.98 on March 1 – meaning inflows this month have not made much money.
This also applies to SPY, the SPDR S&P 500 ETF. Also in the week ended Wednesday, $3 billion came in (courtesy of ETF.com). This was the third straight week of inflows, during which $9.6 billion moved in.
There is a real tug of war going on between bulls and bears. In the last several sessions, the latter succeeded in pushing the cash under both 10- and 20-day moving averages, only to be recaptured by the former. The averages are now going sideways, and probably on the verge of a cross-under, so the bears may have a slight edge here. It remains to be seen how far they can take it. Earnings season gets underway in three weeks. As of Thursday last week, 1Q17 operating earnings estimates were $29.37, down $0.76 so far this quarter. The bar keeps getting lowered.
Euro: Currently net short 41k, down 18.5k.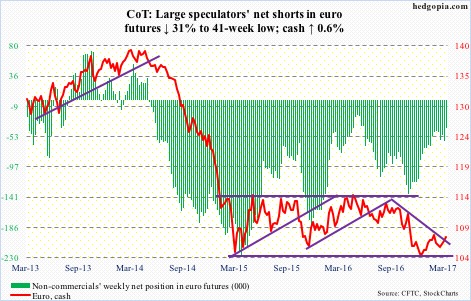
The cash has been trending higher since it dropped to 103.41 on January 3 this year. An attempt to take out resistance at 108-plus was rejected on February 2, when it hit 108.29. That resistance likely gets tested again.
Thursday, in the wake of the Dutch election results, it rallied 0.4 percent, building on Wednesday’s 1.2-percent jump after euro bulls defended the rising 10-day moving average. The 50-day is rising as well.
On the daily chart, there is potentially an inverse head-and-shoulders in the making, the neckline of which lies around the afore-mentioned resistance.
Further, a declining trend line from the May 2016 high gets broken around 109.50, which approximates the 200-day moving average. Long way to go, but worth keeping on the radar.
Gold: Currently net long 106k, down 27.6k.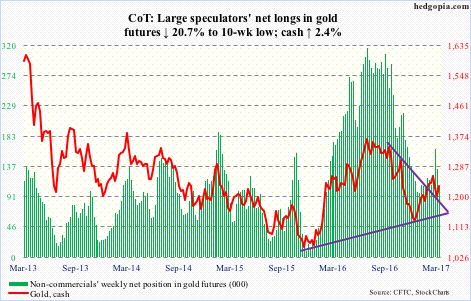
Support at $1,180 held. The cash dropped intraday last Friday to $1,194.5. That was a doji session, followed by another this Tuesday. These ‘indecision’ candles preceded a 0.9 percent jump this Wednesday, when the Fed supposedly delivered a ‘dovish’ hike.
In February, gold bugs had difficulty taking out and then staying above $1,240-ish. In fact, the metal rallied all the way to $1,264.9 on February 27 before getting repelled by the 200-day moving average. Resistance at $1,240-ish likely gets tested again.
In the week ended Wednesday, flows trend improved. GLD, the SPDR gold ETF, attracted $102 million, but more importantly, in the first three sessions this week it pulled in $550 million (courtesy of ETF.com).
Nasdaq 100 index (mini): Currently net long 74.1k, down 673.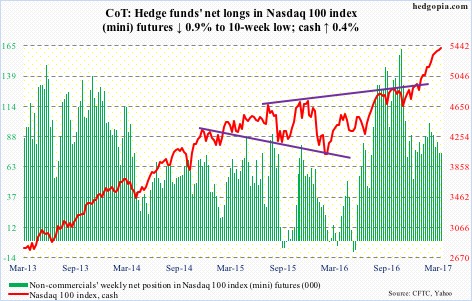
Of the top five Nasdaq 100 weights, Apple (AAPL), Facebook (FB) and Alphabet (GOOGL) enjoyed fresh new highs this week, while Microsoft (MSFT) and Amazon (AMZN) were not that far away from their respective recent record highs.
Bulls continue to defend shorter-term daily moving averages, including Wednesday (FOMC decision day) when it rallied 0.6 percent. Interestingly, in that session, QQQ, the PowerShares Nasdaq 100 ETF, lost $446 million. In the week ended Wednesday, $775 million was withdrawn (courtesy of ETF.com).
Russell 2000 mini-index: Currently net short 24.7k, up 12.3k.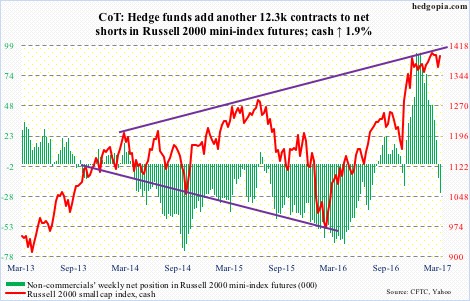
Support at 1347 came close to being tested when the cash dropped to 1353.47 on Tuesday. This was followed by a 1.5-percent jump on Wednesday, past its 50-day moving average. Bulls’ real test lies around 1392, which is where the index closed Friday. If this resistance gives way, it might even cause some squeeze.
End-February short interest on IWM, the iShares Russell 2000 ETF, stood at 117.6 million – a three-month high and up from 93.7 million from mid-January.
It might all come down to flows.
In the week ended Wednesday, $328 million moved into IWM (courtesy of ETF.com). This followed outflows of $1.1 billion in the prior three.
US Dollar Index: Currently net long 47.7k, down 3.3k.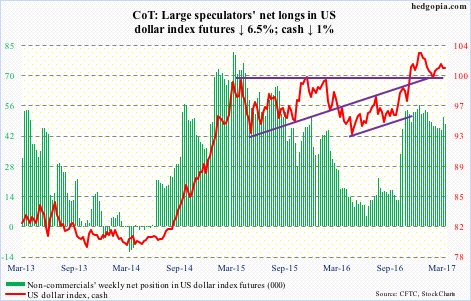
The right shoulder of a potential head-and-shoulders continued to develop on the cash. The post-FOMC, one-percent drop on Wednesday in particular points to bulls throwing up their hands in resignation – at least near term.
The level to watch is 99 and change, which is where the neckline lies. Right underneath – just south of 99 – lies trend-line support from early May last year. It is a must-save for the bulls.
VIX: Currently net short 100.6k, up 946.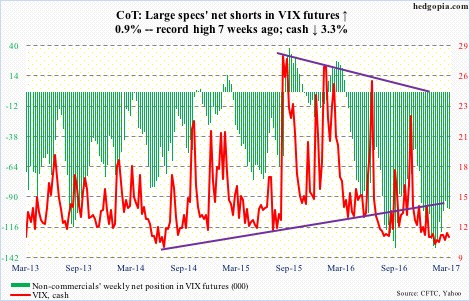
Yet another week in which the cash was unable to sustain above the 50-day moving average. In fact, intraday both Wednesday and Friday it was pushed under 11 before it managed to close above.
In keeping with this, VXX, the iPath S&P 500 VIX short-term futures ETN, made yet another low. It almost feels like longs are capitulating. Month-to-date (as of Wednesday), it lost $162 million. This compares with inflows of $326 million post-November 8 presidential election last year.
