
Following futures positions of non-commercials are as of April 4, 2017.
10-year note: Currently net short 55.8k, down 13.9k.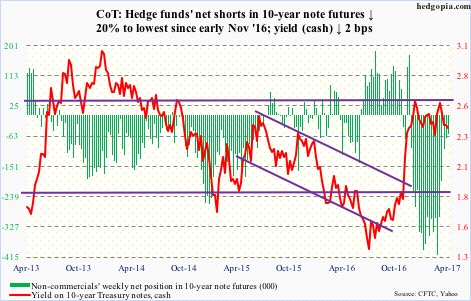
Post-FOMC minutes Wednesday, the S&P 500 large cap index reversed hard, shedding 1.1 percent between 2 pm and 3:30 pm. This was the largest intraday reversal since February last year. Markets clearly did not like what they heard.
Early March, fed funds futures were placing 30-percent odds of a hike in the mid-month meeting. Then began jawboning from several Fed officials. Markets quickly rerated. In a matter of a few days, a hike was baked in. Stocks did not seem to mind at all.
An emboldened Fed now plans to not only throw in at least a couple more hikes this year but also shows a willingness to reduce its balance sheet, which has ballooned to $4.5 trillion.
This is what equities were reacting to Wednesday when minutes for the March 14-15 meeting were released, when FOMC members also discussed stretched equity valuations. Recall that early March William Dudley, New York Fed president, told CNN “animal spirits have been unleashed a bit” post-Nov 8 presidential election.
Add to this the fact that Janet Yellen’s, Fed chair, term expires next January. She probably would like to be the one who began a process of balance sheet normalization. If Wednesday is a sign of things to come, she is in for a duel with stocks.
Several times in the past – at least post-financial crisis – in stocks versus the Fed the latter consistently blinked when the former threw a tantrum. Unless stocks manage to totally ignore this planned double-tightening – not likely – it will be interesting to find out how far the Fed is willing to go.
30-year bond: Currently net short 23.1k, up 2.7k.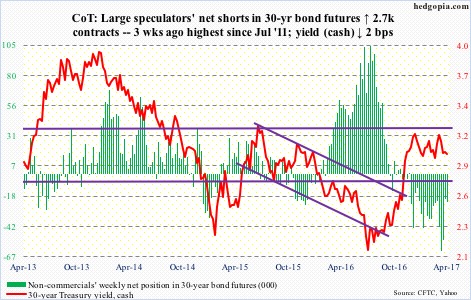
Major economic releases next week are as follows. Markets are closed Friday to observe Good Friday.
Tuesday brings the NFIB optimism index (March) and JOLTS (February).
Post-election, in a couple of months through December, small-business optimism surged 10.9 points to 105.8 – a 13-year high. January and February were essentially unchanged – 105.9 and 105.3, respectively. This optimism, however, is yet to translate into factors such as capX and comp plans.
Non-farm job openings rose 87,000 month-over-month in January to 5.63 million. Openings peaked at 5.97 million last July, which was essentially flat with 5.89 million in July 2015 and 5.85 million last March.
On tap for Thursday include PPI-FD (March) and the University of Michigan’s consumer sentiment (April, preliminary).
February producer prices for final demand increased 0.3 percent m/m and by 2.2 percent in the 12 months through February. Core PPI rose 0.3 percent m/m and 1.8 percent in the 12 months through February.
Consumer sentiment inched up six-tenths of a point m/m to 96.9 in March. January’s 98.5 was a 13-year high.
CPI (March) and retail sales (March) come out on Friday.
Consumer prices inched up 0.1 percent in February; in the 12 months through February, they rose 2.7 percent. Core CPI rose 0.2 percent m/m and 2.2 percent in the 12 months through February. This was the 16th straight year-over-year increase of north of two percent.
Retail sales for February barely grew m/m – up 0.08 percent – but jumped 5.7 percent y/y to a seasonally adjusted annual rate of $474 billion.
Crude oil: Currently net long 421k, up 9.6k.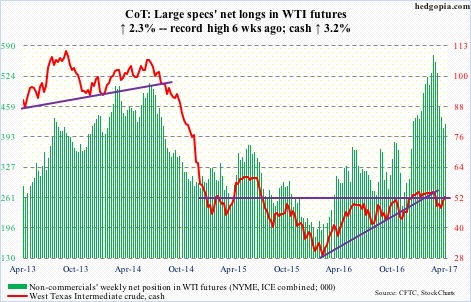
The trend in inventory remains intact – crude making new highs and gasoline/distillates declining.
In the week ended March 31, U.S. crude stocks increased 1.6 million barrels to 535.5 million barrels – yet another record.
Gasoline and distillate stocks fell by 618,000 barrels to 239.1 million barrels and by 536,000 barrels to 152.4 million barrels, respectively. In the last seven weeks, gasoline inventory declined by 20 million barrels, and distillates in the last eight by 18.4 million barrels.
Crude imports fell by 374,000 barrels per day to 7.9 million b/d. And refinery utilization increased 1.5 percentage points to 90.8 percent – a 12-week high.
Crude production continued to inch higher, rising by 52,000 b/d to 9.2 mb/d. Since OPEC reached a cutback agreement late November last year, U.S. production has gone up by nearly 500,000 b/d!
Wednesday – the day the EIA released the report – spot West Texas Intermediate crude acted confused, up 0.2 percent but with a wide range of $51.88 and $50.74. The long-legged doji session tested resistance at $51-$52, which it lost a month ago.
Then the Syria air strikes changed trader sentiment, with the crude finding support on the 50-day moving average to rally one percent on Friday, closing at $52.24 – right at resistance.
Near term, odds favor it proceeds to unwind daily overbought conditions. The 200-day lies at $48.79. There is decent support at $47.
E-mini S&P 500: Currently net long 120.7k, down 40.1k.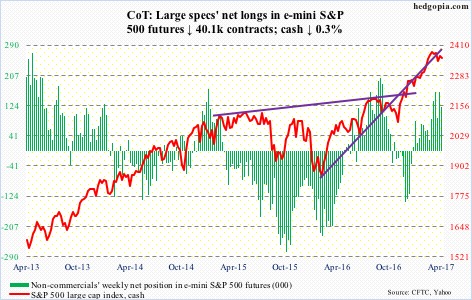
In the week ended Wednesday, U.S.-based equity funds lost $11.9 billion – the largest outflows in 15 weeks (courtesy of Lipper). In the same week, $7 billion was withdrawn from SPY, the SPDR S&P 500 ETF (courtesy of ETF.com).
The majority of these outflows took place before Wednesday, when, responding to the FOMC minutes, the S&P 500 (cash) reversed hard, down 1.2 percent from session high to low. Resistance at 2370 held, as did the declining trend line from March 1.
The 50-day moving average – still slightly rising – has been tested several times in the past couple of weeks. The bulls cannot afford to lose it.
Euro: Currently net short 11.4k, up 3.5k.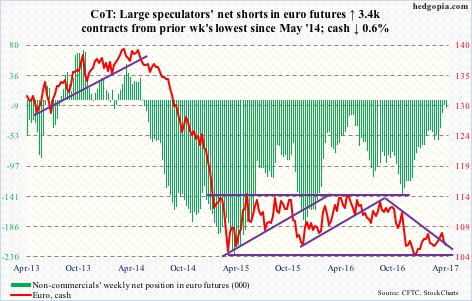
Mario Draghi, ECB president, said Thursday that the bank’s policy is appropriate and there is no need to start tightening. But Jens Weidmann, Bundesbank chief, however, was asking for an unwinding of stimulus.
In all five sessions, the euro was repelled by the now slightly dropping 50-day moving average – particularly Friday.
The currency has been under pressure since March 27 when it was rejected at the 200-day, which at the time also approximated a declining trend line from last May. This week, it also lost a rising January 2016 trend line. Euro bulls have their work cut out near term.
Gold: Currently net long 155.4k, up 17.6k.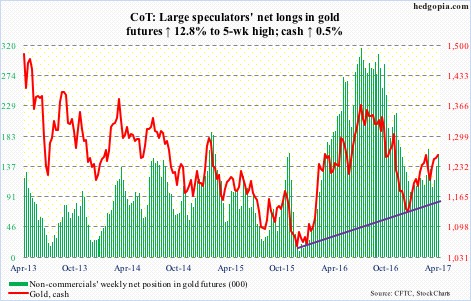
Yet another test of the 200-day moving average on the cash. Since February 27, this average has been tested several times. And it has come in the wake of a 12-plus-percent rally since December 15 last year. (The Fed hiked rates on December 14, by the way.)
This is as good a spot as any for the metal to take a rest. Friday’s reversal in particular is noteworthy – up 0.3 percent, but was up 1.6 percent at one time.
The 50-day – still slightly rising – rests at $1,233.88, and likely gets tested near term.
In the week ended Wednesday, GLD, the SPDR gold ETF, gained $130 million (courtesy of ETF.com).
Nasdaq 100 index (mini): Currently net long 94k, up 8.7k.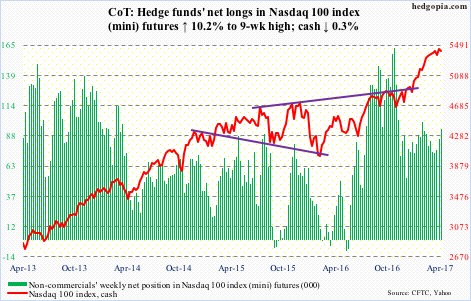
In the week ended Wednesday, QQQ, the PowerShares Nasdaq 100 ETF, lost $900 million, which followed $1.2 billion in inflows in the prior week (courtesy of ETF.com).
Wednesday, the cash rose to yet another high (5479.86) before reversing hard. Also in that session, of the top five Nasdaq 100 weights, barring Alphabet (GOOGL), the remaining four – Apple (AAPL), Facebook (FB), Amazon (AMZN) and Microsoft (MSFT) – all rose to fresh all-time highs before doing a U-turn.
The index is 1.7 percent away from the 50-day moving average, which will be a first test this year should it occur.
Russell 2000 mini-index: Currently net short 55.8k, down 551.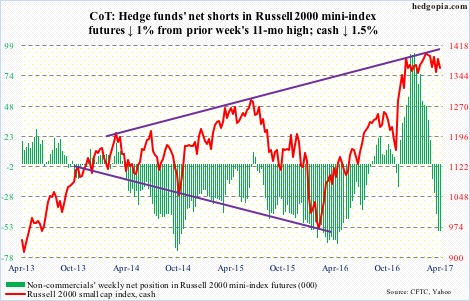
IWM, the iShares Russell 2000 ETF, lost $633 million in the week ended Wednesday; in last nine sessions, the ETF saw inflows just twice (courtesy of ETF.com).
That said, the cash remains range-bound between 1392 and 1347 … has been that way the past four months. On March 31, it kissed the upper end, and four days later (Thursday) the lower end. A convincing breakdown likely opens the door for a test of the 200-day moving average – 5.4 percent away – but support has to give way first.
US Dollar Index: Currently net long 43k, down 1.3k.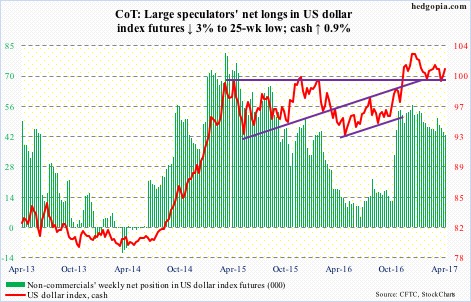
Since the cash defended the 200-day moving average on March 27, it has been on a slight uptrend.
The 50-day (100.61) is where the bulls and bears fought a good tug of war. This area also approximates horizontal resistance from March 2015 – hence crucial. On the weekly chart, there is plenty of room for the index (101.12) to rally – as long as this support holds.
VIX: Currently net short 94.5k, down 8.3k.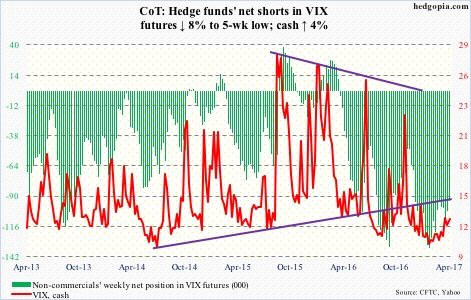
In the week ended Wednesday, VXX, the iPath S&P 500 VIX short-term futures ETN, lost another $106 million. This followed outflows of $275 million in the prior week (courtesy of ETF.com). Thursday, though, $39 million came in.
The cash is playing ping pong between 50- and 200-day moving averages. A mere 1.41 points separate the two. Thursday say volatility bulls defending the 50-day but unable to take out the 200-day. The latter was tested again Friday.
That said, the bottom of the multi-year range continues to draw buyers, as was the case Wednesday when VIX (12.87) fell under 11.
