Following futures positions of non-commercials are as of September 24, 2019.
10-year note: Currently net short 196.3k, down 33.7k.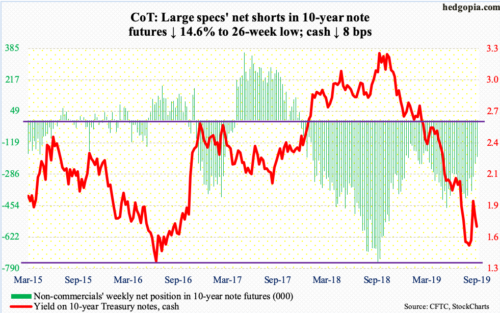
On September 3, the 10-year Treasury yield dropped to 1.43 percent intraday, nine basis points from the record low 1.34 percent set in July 2016. It was on that day TLT (iShares 20+ year Treasury bond ETF) retreated from $148.67, just $0.23 from matching its all-time high of $148.90 from August 28. (Yields move opposite price.)
Since that high, TLT came under pressure, slicing through its 50-day moving average. By the 13th this month, it was down to $136.54, before bulls put their foot down. The average was reclaimed. At $142.73, it is currently in no-man’s land, sandwiched between that average and short-term horizontal resistance at $143.80s.
Throughout all this, bond bulls never lost hope. Through Wednesday this month, TLT took in $2.2 billion (courtesy of ETF.com). In the first half this month, they were hurting, as the 10-year rate (1.68 percent) rose all the way to 1.9 percent, before reversing and going on to lose – again – the 50-day. It just feels like rates for now are itching to move lower. In this scenario, the early-September low is an important reference point.
All this is unfolding as non-commercials continue to cut back their net shorts in 10-year note futures.
30-year bond: Currently net short 58.3k, up 12.1k.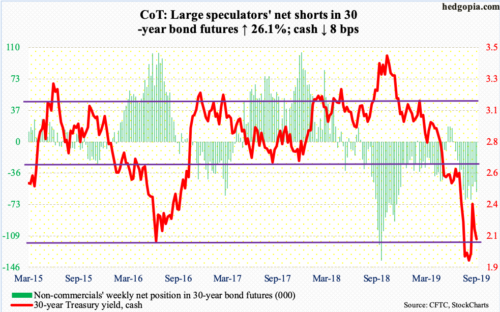
Major economic releases next week are as follows.
September’s ISM manufacturing index is due out Tuesday. In August, manufacturing activity contracted, down 2.1 points month-over-month to 49.1. This was the first sub-50 reading in three years.
The ISM non-manufacturing index (September) and durable goods orders (August, revised) will be published Thursday.
ISM services activity in August rose 2.7 points m/m to 56.4.
Preliminarily, August orders for non-defense capital goods ex-aircraft – proxy for business capex plans – shrank 0.3 percent year-over-year to a seasonally adjusted annual rate of $69.3 billion. This is the first back-to-back y/y decline in 33 months.
Friday brings September’s employment report. In August, the economy added 130,000 non-farm jobs, for a monthly average this year of 158,000. In 2018, the monthly average was 223,000.
WTI crude oil: Currently net long 590.6k, down 843.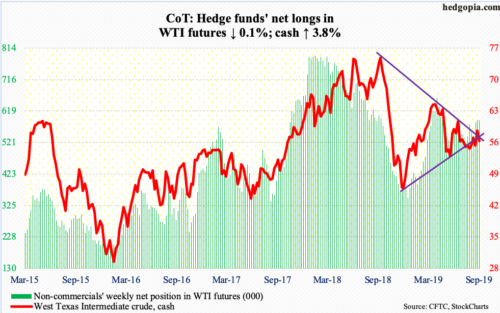
The cash ($55.91/barrel) peaked last October at $76.90 and bottomed in December at $42.36. Trend lines drawn from those price points resulted in a wedge, which, post-attack on Saudi oil facilities, the crude broke out of last week. This week, it fell back into it. The wedge has narrowed to a point where a decision is just a matter of time. Friday, WTI broke down intraday, but managed to close on support, which lies around $55.75. The 50- and 200-day are at $56.04 and $56.50 respectively. A convincing breach likely opens the door to a test of $50-51 eventually.
The EIA report for the week of September 20 was mostly negative. US crude production rose 100,000 barrels per day to 12.5 million bpd, matching the all-time high of a month ago. Stocks of crude and gasoline increased 2.4 million barrels and 519,000 barrels to 419.5 million barrels and 230.2 million barrels, in that order. Distillates, on the other hand, fell three million barrels to 133.7 million barrels. Crude imports dropped 672,000 bpd to 6.4 mbpd. Refinery utilization fell 1.4 percentage points to 89.8 percent.
E-mini S&P 500: Currently net long 5.5k, up 17.2k.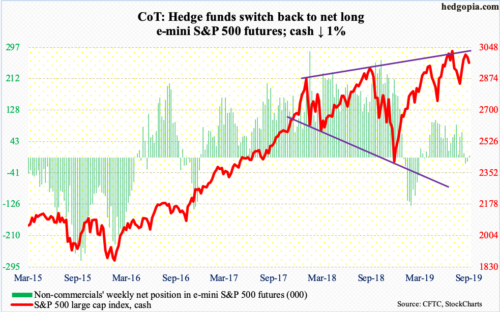
US-based equity funds in the week to Wednesday lost $12.6 billion, which essentially equaled the $12.8 billion in inflows in the prior couple of weeks (courtesy of Lipper). In the same week, SPY (SPDR S&P 500 ETF), VOO (Vanguard S&P 500 ETF) and IVV (iShares Core S&P 500 ETF) gained a combined $1.5 billion, which followed $10.6 billion in inflows in the prior two (courtesy of ETF.com).
Bulls struggled this week, but bears were not able to wrest complete control either. The cash (2961.79) lost one percent. Friday, breakout retest at 2940s held. The 50-day at 2948.82 lies there as well.
With that said, shorter-term averages are beginning to roll over. Odds favor continued downward pressure ahead. Trend-line support from last December lies at 2925, and the 200-day at 2832.89.
Euro: Currently net short 60.7k, down 7.8k.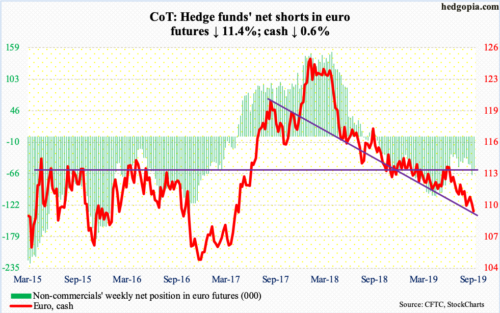
This month, the cash ($109.39) dropped to $109.20s twice – $109.29 on the 3rd and $109.27 on the 12th. With an intraday low of $109.09 Thursday, those lows were breached. With this, the pattern of lower highs/lower lows remains intact. The euro peaked in January last year at $125.37. Bulls now have to deal with resistance just north of $110.
Gold: Currently net long 312.4k, up 29.8k.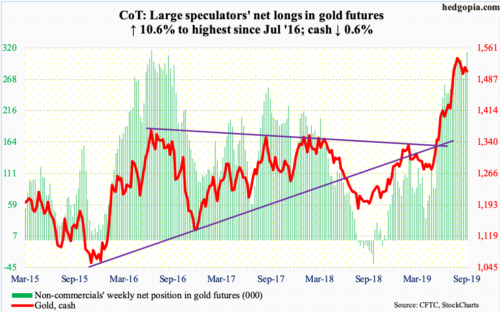
Money continues to move into gold-focused ETFs, with GLD (SPDR Gold ETF) and IAU (iShares Gold Trust) respectively pulling in $2 billion and $258 million in the week to Wednesday (courtesy of ETF.com).
The cash ($1,506.40/ounce), however, continued to consolidate, which it has for several weeks now.
On the 4th, gold tagged $1,566.20 intraday. Before that, it struggled in $1,540s-50s for three weeks. This is an important price point. In September 2011, the metal peaked at record $1,923.70 and began to unravel after it lost $1,540s-50s. As well, a 61.8-percent Fibonacci retracement of the September 2011-December 2015 decline lies at $1,588.
Gold has had quite a rally, having based in $1,260s in April-May. The weekly is overbought. For several sessions in the middle of this month, gold bugs defended the 50-day ($1,499.48). This again occurred Friday. A breakdown likely opens the door to breakout retest at $1,440s-50s.
Nasdaq 100 index (mini): Currently net long 13.8k, down 21k.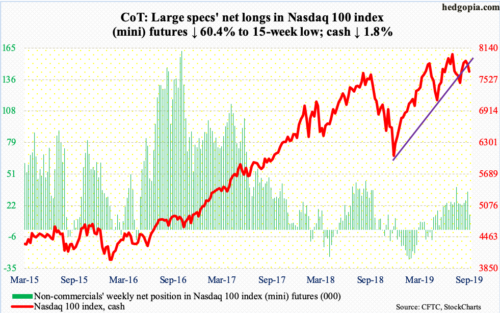
Bulls are doing all they can to defend a rising trend line from last December. Friday, the cash (7681.58) made an intraday low of 7626.82. This followed Wednesday’s low of 7647.63. Throughout August, they used this trend line to step up to the plate, followed by horizontal breakout at 7750 early this month. The subsequent rally still resulted in a lower high – 7975.33 on September 12 versus record high 8027.18 on July 26.
As things stand, odds of a breach (on an intraday basis) of the trend line in question are rising. The weekly remains overbought, with subtle signs of distribution. The 50-day at 7752.13 approximates the aforementioned horizontal support.
In the week to Wednesday, QQQ (Invesco QQQ Trust) attracted $158 million (courtesy of ETF.com). This followed inflows of $523 million in the prior week and $1.3 billion before that.
Russell 2000 mini-index: Currently net short 31.3k, up 6.5k.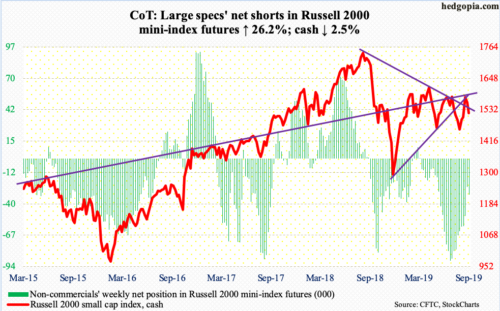
Two weeks ago, the cash (1520.48) surged 4.9 percent, breaking out of a falling trend line from August last year but stopping short of reclaiming a broken rising trend line from last December. Then on the 16th, it rallied to 1590.50 intraday before retreating. Resistance just north of 1600 goes back to January last year.
Friday, the Russell 2000 pierced through the 50-day, closing right on the 200-day. A genuine breach exposes the index to a test of support at 1450s, which was defended several times in August.
In the week to Wednesday, $1.5 billion came out of IWM (iShares Russell 2000 ETF), even as IJR (iShares Core S&P Small-Cap ETF) took in $191 million (courtesy of ETF.com).
US Dollar Index: Currently net long 41.9k, up 165.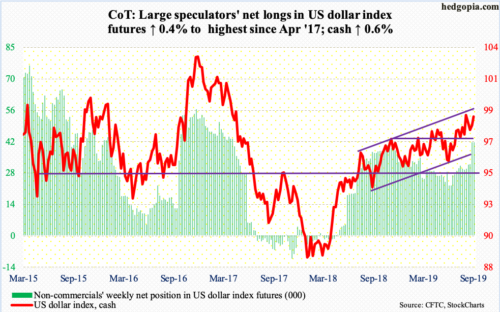
After defending the 50-day for nearly two weeks, the cash (98.76) pushed higher on Wednesday. Friday’s intraday high of 98.96 fell just short of the daily upper Bollinger band. For now, bulls need to clear 99.33, which on the 3rd kissed the upper bound of a 13-month rising channel. That resistance now lies at 99.50.
VIX: Currently net short 148.5k, up 22.9k.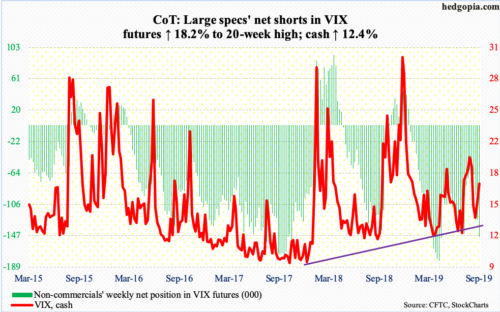
Volatility bulls Wednesday were unable to hang on to the intraday high of 18.45 but come Friday the 50- and 200-day were recaptured. A golden cross just completed.
For now, the cash (17.22) is held up by a falling trend line from early August when it retreated from 24.81. A breakout will add to momentum.
At the same time, the 21-day moving average of the CBOE equity-only put-to-call ratio ended the week at 0.645. Tuesday, it dropped to 0.632. Earlier on August 23, it peaked at 0.733. Normally, it tends to bottom at high-0.50s to low-0.60s. Once it bottoms, it tends to peak at high 0.60s to low 0.70s, which is what took place mid-August. A rise in the ratio tends to coincide with a drop in the S&P 500.
Thanks for reading!

