
Following futures positions of non-commercials are as of December 3, 2019.
10-year note: Currently net short 221.9k, up 76.2k.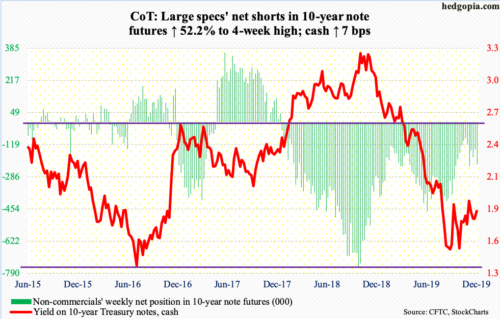
Next week, the FOMC meets. It is this year’s eighth and last meeting. Markets do not expect the Fed to move. Year-to-date, the fed funds rate has been reduced three times in 25-basis-point increments, to a range of 150 to 175 basis points. The last easing was late October.
In the futures market, before Friday’s payroll report showed November added 266,000 non-farm jobs, it was not until July next year the odds of a 25-basis-point cut were above 50 percent. After the report, this got pushed up to September. In other words, no one expects the Fed to ease again anytime soon.
This, of course, will change if manufacturing recession spreads, particularly if the hitherto-strong jobs market shows signs of cracking and the ever-reliable consumers begin to act frugal. So far, that is not the case.
Amidst this, the bond market continues to act cautious. The 10-year Treasury yield (1.84 percent) dropped all the way to 1.43 percent early September. The rally from that low ended November 7 at just under two percent. Nevertheless, there has been a pattern of higher lows the past three months, but no higher highs yet. For that to happen, the 10-year has to eclipse 1.97 percent. Non-commercials, who have been adding to net shorts, would like that.
30-year bond: Currently net short 90.4k, up 19.1k.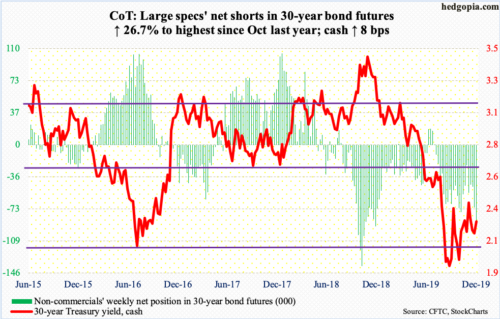
Major economic releases next week are as follows.
The NFIB optimism index (November) and productivity (3Q19, revised) are due out Tuesday.
Small-business optimism in October rose six-tenths of a point month-over-month to 102.4. This was the 35th straight monthly reading of 100-plus.
Preliminarily, output/hour fell at an annual rate of 0.3 percent in 3Q19. This was the first quarter-over-quarter drop in 15 quarters.
The CPI (November) and FOMC decision (December 10-11) come out Wednesday.
In October, headline and core consumer prices respectively rose 0.4 percent and 0.2 percent m/m. In the 12 months to October, they increased 1.8 percent and 2.3 percent, in that order.
The PPI (November) is scheduled for Thursday. Producer prices rose 0.4 percent m/m in October. In the 12 months to October, they climbed 1.1 percent. Core PPI increased 0.1 percent and 1.5 percent over the same time period.
Friday brings retail sales (November). In the 12 months to October, sales grew 3.1 percent to a seasonally adjusted annual rate of $526.5 billion. The record high $526.9 billion was recorded in August.
WTI crude oil: Currently net long 611.5k, down 41.6k.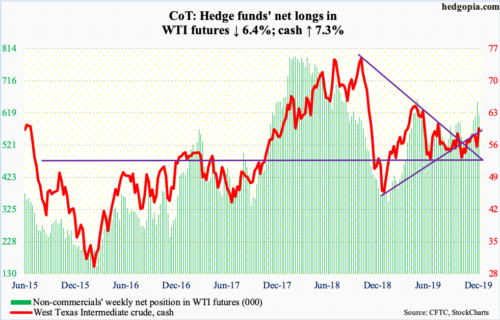
For a month now, the cash ($59.20/barrel) more or less traded between the 50- and 200-day moving averages ($55.65 and $57.54, respectively). Last Friday, the crude fell through the 200-day to close just under the 50-day, with the session low finding support at a rising trend line from early October as well as the daily lower Bollinger band.
Monday this week, the 50-day was recaptured, followed by the 200-day Wednesday. A crucial test is likely ahead. Just north of $60 lies trend-line resistance from October last year when the crude peaked at $76.90.
The EIA report for the week to November 29 was a mixed bag. US crude production remained unchanged at record 12.9 million barrels per day. Gasoline and distillate stocks increased 3.4 million barrels and 3.1 million barrels respectively to 229.4 million barrels and 119.5 million barrels. Crude stocks, on the other hand, fell 4.9 million barrels to 447.1 million barrels. Crude imports dropped 201,000 bpd to 6 mbpd. Refinery utilization rose 2.6 percentage points to 91.9 percent.
E-mini S&P 500: Currently net short 39k, up 22.2k.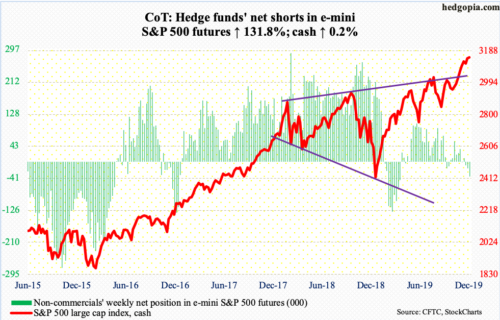
Wednesday last week, the cash (3145.91) printed an all-time high of 3154.26 to tag the daily upper Bollinger band. By Tuesday this week, the S&P 500 fell to 3070.33 to just about kiss the lower band. That low was bought. Again Thursday, bulls bought the session low. Both those sessions produced candles with long lower shadows. The candles have a hammer look to them, but it is equally possible the pattern is that of a hanging man. The latter shows up in an uptrend and can be a sign that sentiment is beginning to turn. Similarly, a massive dragonfly doji showed up on the weekly. More sellers are entering the market, but the pattern needs confirmation.
Bulls have seasonality in their favor and seem to be getting ready. In the week to Wednesday, US-based equity funds took in $5 billion (courtesy of Lipper). In the same week, SPY (SPDR S&P 500 ETF), VOO (Vanguard S&P 500 ETF) and IVV (iShares Core S&P 500 ETF) together attracted $6.7 billion (courtesy of ETF.com).
Euro: Currently net short 69k, up 7.6k.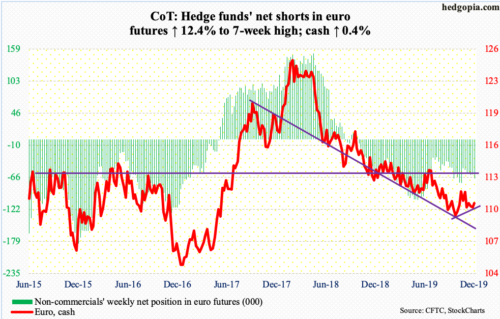
The week began with Monday’s recapturing of the 50-day ($110.51), followed by Wednesday’s high of $111.16. Should the cash ($110.58) go on to rally to test the 200-day at $111.65, it would have broken through a falling trend line from September last year. Then comes the November 1st high of $111.82. A higher high will strengthen bulls’ case. Down below, besides the 50-day, two-month trend-line support rests at $110.
Gold: Currently net long 290.7k, up 19.1k.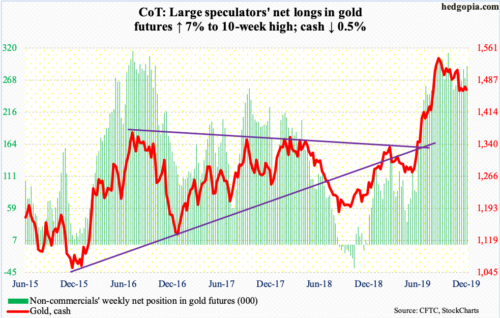
After successfully defending support at $1,440s-50s twice last month, the cash ($1,465.10/ounce) proceeded to test the 50-day ($1,485.71), where it faced resistance in all of the last four sessions this week. Tuesday’s high of $1,489.90 got denied at a falling trend line from early September when gold peaked at $1,566.20. A breakout would have opened the door to a test of $1,520s, and hopefully for gold bugs, the September high. Now, it is looking increasingly likely $1,440s-50s gets tested again.
Throughout all this, flows were not in cooperation. In the week to Wednesday, IAU (iShares Gold Trust) and GLD (SPDR Gold ETF) respectively lost $18 million and $372 million (courtesy of ETF.com).
Nasdaq 100 index (mini): Currently net long 22.1k, down 11.1k.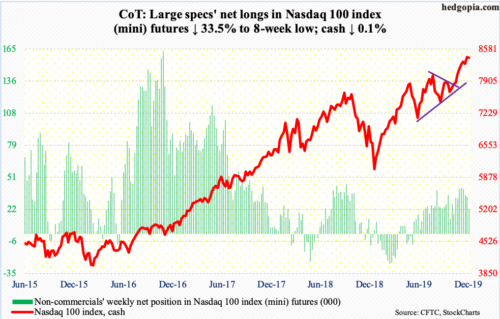
In the four sessions through Tuesday, the cash (8397.37) quickly shed 3.3 percent intraday. By that time, the Nasdaq 100 was underneath both the 10- and 20-day. Bulls were not going to give up that easy. They aggressively bought Tuesday’s low and by Friday had reclaimed the averages. Last week’s all-time high of 8445.61 is now within striking distance.
In the week to Wednesday, QQQ (Invesco QQQ Trust) took in $232 million (courtesy of ETF.com). In the prior two, $1.5 billion was withdrawn.
Russell 2000 mini-index: Currently net long 30.8k, up 24.1k.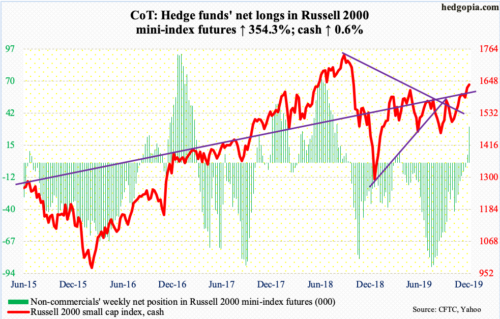
Non-commercials aggressively added to their net longs this week.
Last week, the cash (1633.84) broke out of major resistance just north of 1600. This week did not start out well. In fact, intraday Tuesday the Russell 2000 was once again pushed under that price point. That weakness was bought. Breakout retest was successful.
The index remains above both the 10- and 20-day. As long as this continues, bulls deserve the benefit of the doubt. One potential roadblock they face is the extended conditions, weekly in particular. But as things stand, it is their ball to lose.
US Dollar Index: Currently net long 23.9k, down 261.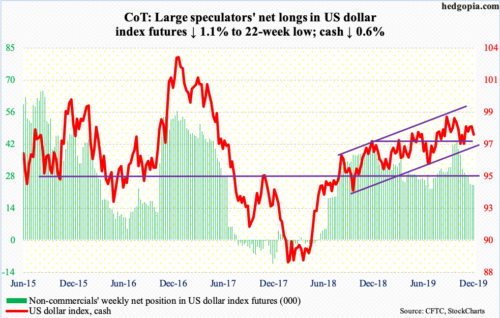
A doji formed on the weekly last week. This week, the cash (97.66) dropped in all of the first four sessions. After tagging 98.50 intraday last Friday, the US dollar index opened this week with a loss of the 50-day. By Thursday, it was clinging on to the 200-day; Friday’s intraday loss of the average (97.38) was bought. The daily is now itching to move higher.
VIX: Currently net short 199.3k, down 11.4k.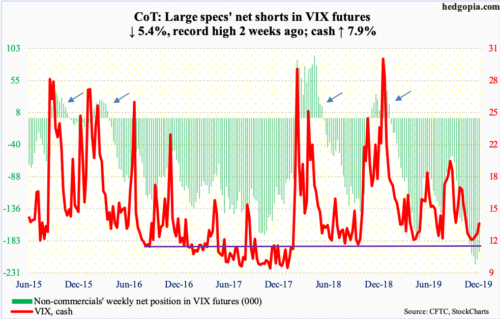
The cash (13.62) rallied strongly early on. Through Tuesday’s intraday high of 17.99, VIX was up 5.37 points for the week. Volatility bulls were not able to hang on to the gains, however. Once again, the falling trend line from last December’s high resisted the breakout attempt. For now, there is room for the daily to continue lower. Longer-term, the weekly remains grossly oversold.
Amidst this, the 21-day moving average of the CBOE equity-only put-to-call ratio reached 0.572 on November 22. This was the lowest since July last year. It closed out the week at 0.585. Historically, the ratio tends to bottom at high 0.50s to low 0.60s, when investor optimism is very high. Once the process of unwinding begins in earnest, stocks pull back.
Thanks for reading!
