
Following futures positions of non-commercials are as of December 17, 2019.
10-year note: Currently net short 245.3k, up 66.4k.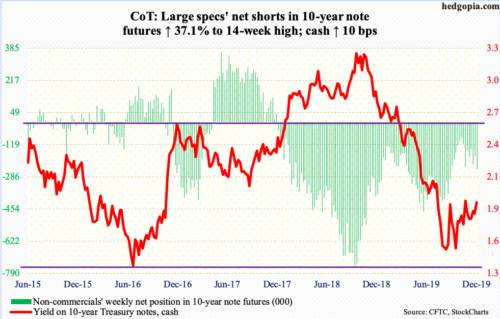
Bond bears (on price) keep hammering on a potentially crucial level. The 10-year Treasury yield (1.92 percent) dropped to 1.43 percent early September – just about matching the July 2012 low of 1.39 percent and the low four years after that of 1.34 percent. The rally since the September low ended November 7 at just under two percent – 1.97 percent, to be exact. A convincing takeout of this level will have established a pattern of higher highs. Since September, there has already been a pattern of higher lows. The 200-day moving average lies at 2.02 percent.
Non-commercials obviously are betting that this in due course gets resolved with the 10-year yield breaking this logjam and heading higher. This week, they took their holdings of net shorts to a 14-week high. At least for now, momentum is on their side.
30-year bond: Currently net short 100.1k, down 6.9k.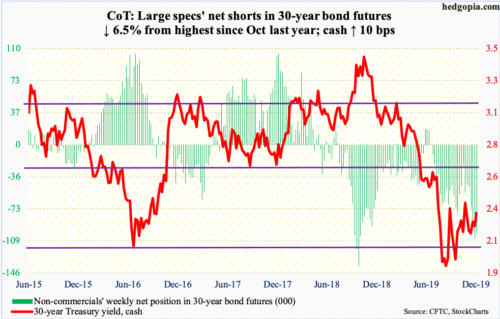
Major economic releases next week are as follows. It is a holiday-shortened week. Merry Christmas!
New home sales (November) are due out Monday. October sales were down 0.7 percent month-over-month to a seasonally adjusted annual rate of 733,000 units. September’s 738,000 units were the highest since July 2007.
Tuesday brings durable goods orders (November). In the 12 months to October, orders for non-defense capital goods ex-aircraft – proxy for business capex plans – fell 0.9 percent to $69.3 billion (SAAR). The all-time high of $70 billion was hit in July last year. October’s drop was the fourth monthly contraction in a row. The last time this metric dropped y/y was in November 2016. Back then, the drop was much more severe – both in terms of magnitude and duration.
WTI crude oil: Currently net long 716.3k, up 28k.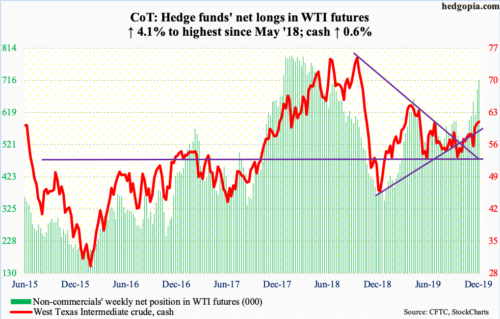
The cash ($60.44/barrel) broke out of a falling trend line from October last year when it peaked at $76.90. WTI then bottomed last December at $42.36. A rising trend line drawn from that low has been persistently defended, resulting in higher lows. Given this, bulls must find this week’s breakout encouraging, although Friday’s trading resulted in a weekly candle with a long upper shadow. They now need a higher high for an uptrend to establish, which will occur once the mid-September high of $63.38 gets taken out. For now, the daily is itching to head back down.
The EIA report for the week of December 13 showed crude production was unchanged at 12.8 million barrels/day. As was refinery utilization rate, which remained flat at 90.6 percent. Crude imports dropped 308,000 b/d to 6.6 mb/d. Crude inventory fell as well, down 1.1 million barrels to 446.8 million barrels. Stocks of gasoline and distillates, on the other hand, rose – up 2.5 million barrels and 1.5 million barrels to 237.3 million barrels and 125.1 million barrels respectively.
E-mini S&P 500: Currently net short 13.5k, down 5.1k.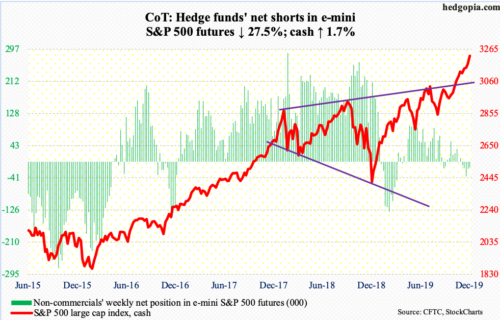
In a seasonally favorable period, bulls are not wasting any opportunity to defend support and buy the dips. For the last several sessions, the cash (3221.22) has rallied all along the daily upper Bollinger band. With both the daily and weekly RSI into the 70s – 75.7 and 73.4 respectively – conditions are overbought, but bulls have the momentum.
Interestingly, in the week to Wednesday, SPY (SPDR S&P 500 ETF), VOO (Vanguard S&P 500 ETF) and IVV (iShares Core S&P 500 ETF) took in $2 billion. In the same week, US-based equity funds lost $32.2 billion, for a year-to-date loss of $211.2 billion. This has been offset by still-aggressive corporate buybacks and substantially reduced selling of US stocks by foreigners as well as increase in the Fed’s balance sheet in recent months (more on this here).
Euro: Currently net short 65.7k, down 1.9k.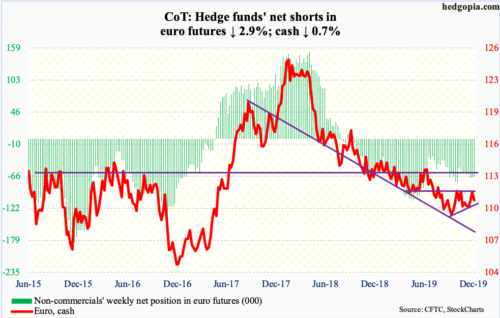
One more week, one more attempt at reclaiming the 200-day ($111.55) and one more failure. Tuesday, the cash ($110.78) rallied past the average intraday but could not close it, with the high of $111.75 once again falling short of the November 1st high of $111.82.
The euro has made higher lows since bottoming on October 1 but has not been able to post a higher high. Resistance at $111.70s-80s is holding firm. The 50-day ($110.84) was lost Friday. Just north of $110, the rising trend line from October gets tested.
Gold: Currently net long 286.3k, up 15.4k.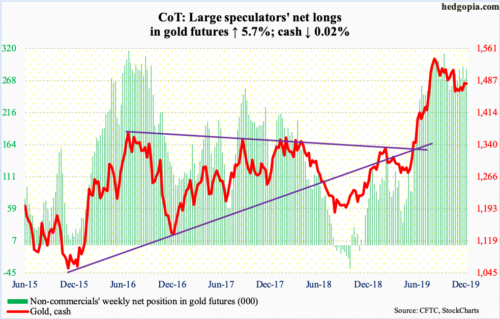
In the week to Wednesday, IAU (iShares Gold Trust) took in $66 million, while GLD (SPDR Gold ETF) lost $139 million (courtesy of ETF.com). In the prior couple of weeks, $469 million came out of GLD.
Gold bugs nevertheless have managed to linger around an important price point. The cash ($1,480.90/ounce) peaked at $1,566.20 early September. A falling trend line from that high resisted rally attempts several times this month, including this week. The 50-day ($1,480.54) lies right there.
This preceded persistent defense of $1,440s-50s last month. This should give bulls hope that a breakout is imminent. A rally past $1,480s opens the door to a test of $1,520s, and the September high. In the event the metal comes under pressure, there is trend-line support at $1,455-70.
Nasdaq 100 index (mini): Currently net long 7.9k, down 4.3k.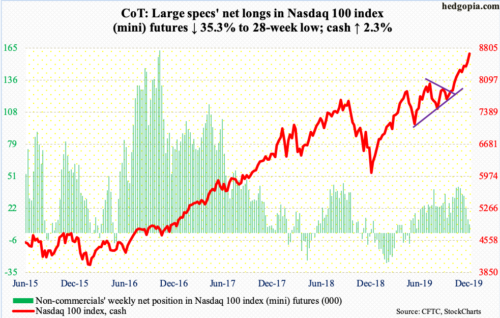
Since breaking out of just north of 8000 eight weeks ago, the cash (8678.49) is yet to experience serious selling. There was one late last month, but it only lasted three sessions. Shorter-term averages, which several sessions ago looked like ready to flatten out, and then head lower, have once again turned back up. Friday, the daily RSI closed at 76.6 and the weekly at 73.7. Needless to say, conditions are overbought, but bulls will take it as long as momentum begets momentum.
In the week to Wednesday, QQQ (Invesco QQQ Trust) took in $1.1 billion (courtesy of ETF.com). In the prior week, it gained by the same amount.
Russell 2000 mini-index: Currently net long 42.6k, up 5.3k.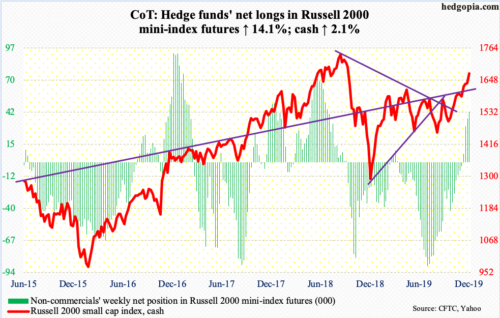
There is a long way to go before the all-time high of 1742.09 from August last year is tested, but small-cap bulls are probably excited about the way things have panned out since the cash (1671.90) broke out of 1600+ a month ago. The Russell 2000 traded within a range for several months before that breakout occurred. Breakout traders would be hoping to at least test last year’s high in order to fulfill measured-price objective. Better flows would help in this regard.
In the week to Wednesday, $139 million moved out of IWM (iShares Russell 2000 ETF), while IJR (iShares Core S&P Small-Cap ETF) attracted $125 million (courtesy of ETF.com).
US Dollar Index: Currently net long 11.7k, down 10.6k.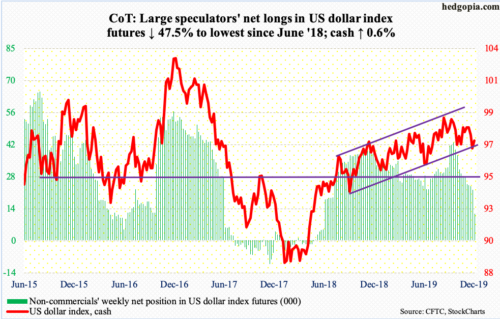
Last week, the cash (97.27) stopped going down at a rising trend line drawn from September last year. This week, that trend line was tested again at Monday’s intraday low of 96.50. The daily is itching to go higher. The 200-day lies at 97.40, which also approximates horizontal resistance at 97.50s. This will then be followed by trend-line resistance from early October at 98.
VIX: Currently net short 173.4k, down 9.7k.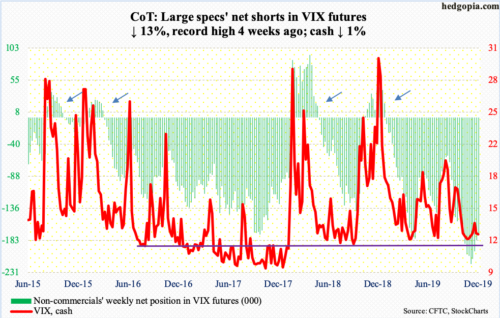
In a week in which the S&P 500 rallied 1.7 percent, the cash (12.51) was essentially flat, down 0.12. VIX started the week with an intraday drop Monday to 11.71, which volatility bulls used as an opportunity to defend. As recently as three weeks ago, VIX rose to 17.99 intraday. So, it has come a long way on the downside in merely three weeks. But it is still caught in a downtrend particularly from early August, when VIX peaked at 24.81. This trend line does not get broken until VIX retakes 17 – a long way to go from where the volatility index sits currently.
Be that as it may, support at 12 is holding. This is probably why non-commercials, unable to squeeze much out of volatility, have begun to reduce their record holdings of net shorts, which are now down four weeks in a row.
For now, volatility bulls would first like to reclaim 13.50. The 50-day (13.31) lies around there, with the 200-day at 15.03.
Thanks for reading!
