
Following futures positions of non-commercials are as of December 31, 2019 (data was published Monday instead of last Friday due to New Year’s holiday).
10-year note: Currently net short 234.8k, down 33.9k.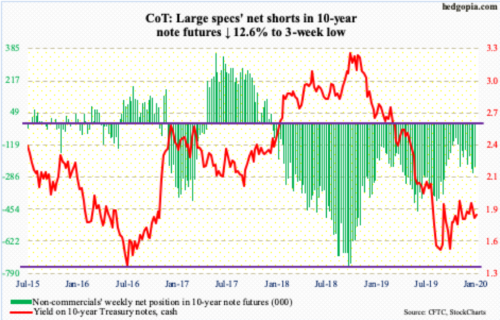
Last week, the 10-year T-yield (1.81 percent) essentially closed on trend-line support from September 3 when it fell to 1.43 percent. That low essentially matched the July 2012 trough of 1.39 percent and the low four years after that of 1.34 percent. Since the September bottom, rates rallied but faced stiff resistance just under two percent.
Last Friday, in reaction to the death of an Iranian general in a US strike, bonds got bid up. The 10-year yield dropped nine basis points to 1.79 percent in that session. The 50-day moving average (1.83 percent) has been lost, albeit slightly. The 200-day lies above, at 1.98 percent.
Hence the importance of the September trend line. A breach can influence, among others, non-commercials, who are heavily net short 10-year note futures. Rates under renewed pressure will go against their bias.
30-year bond: Currently net short 97.1k, down 13k.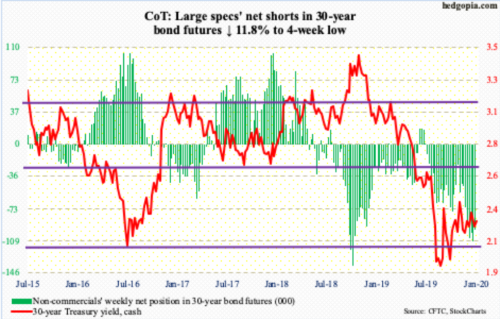
Major economic releases for the remainder of this week are as follows.
The ISM non-manufacturing index (December) and durable goods orders (November, revised) are due out later today.
US services activity in November fell eight-tenths of a point month-over-month to 53.9.
Preliminarily, November orders for non-defense capital goods ex-aircraft – proxy for business capex plans – rose 0.5 percent year-over-year to a seasonally adjusted annual rate of $69.4 billion. This was the first up month in five. Orders peaked in July last year at $70 billion.
Friday brings the employment report (December). In November, the US economy added much-better-than-expected 266,000 non-farm jobs, for a monthly average this year of 180,000, which is healthy but softer than last year’s average of 223,000.
WTI crude oil: Currently net long 758.4k, up 26k.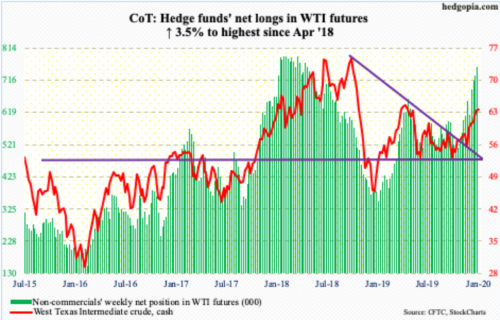
Last Friday, the cash ($63.27/barrel) rallied 3.1 percent in response to rising tensions in the Middle East. Intraday, the crude took out $63.38, which was a high from the middle of September, but was pushed lower by close. This happened again on Monday.
Since early October, WTI has been rallying, with higher lows; bulls have also defended horizontal support at $50-51. So, for seven to eight months now, it is essentially range-bound – between $63-64 and $50-51. A genuine breakout here will be significant.
E-mini S&P 500: Currently net long 60.3k, up 33.3k.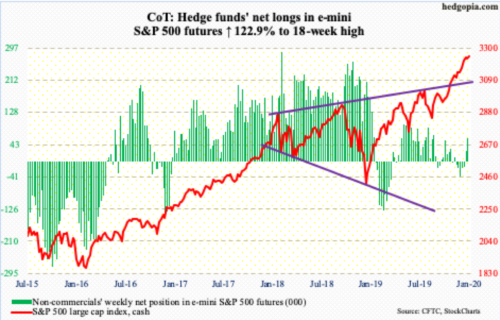
The cash (3246.28) rallied to a new intraday high of 3258.14 Thursday but not before forming a potentially important spinning top for the week. The candle indicates indecision and has come after a big rally since early October. Through Thursday’s high, the S&P 500 added 14 percent. Conditions are stretched. If last week’s action is the beginning of a trend reversal, it needs confirmation.
From bulls’ perspective, the good thing is, they were unwilling last week to easily let go of the still-rising 10-day. Come Monday, the pattern repeated itself. It is only one session into the week, but bulls are hanging in there.
Euro: Currently net short 74.3k, up 1.4k.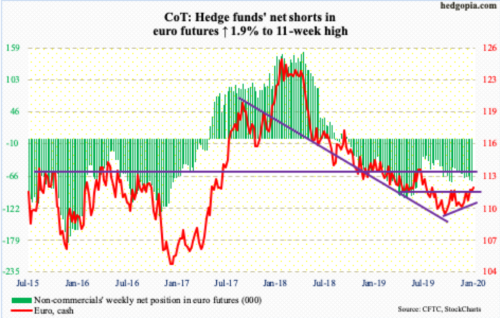
No sooner did euro bulls break through resistance at $111.80s than they lost it, only to then regain it on Monday. On New Year’s Eve, the cash ($111.95) tagged $112.41 intraday before quickly coming under pressure. By Friday, it was testing the 200-day ($111.47). The 50-day, which is now flattish, lies at $110.94. After that lies trend-line support from early October around $110.30. For now, bulls and bears will be fighting for control of $111.80s.
Gold: Currently net long 327.9k, up 22.3k.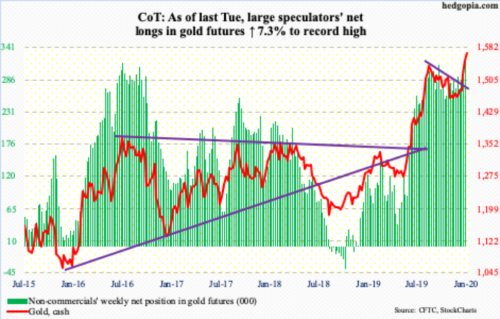
Tensions between the US and Iran did wonders to the cash ($1,568.80/ounce), which rallied 2.3 percent last week. Monday, gold added another 1.1 percent; in fact, it rose to $1,590.90 intraday, but gold bugs were unable to hang on to it, resulting in a shooting star. There is massive resistance at $1,550s-60s, which goes back to April 2011. A breakout can have repercussions for a whole host of assets.
At the same time, non-commercials, who perfectly rode the latest rally in the cash, have now accumulated record net longs. If they are convinced a breakout is not forthcoming, they may begin to cut back.
Nasdaq 100 index (mini): Currently net long 25.6k, up 12.2k.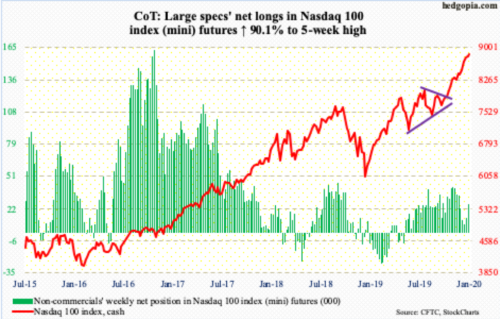
Through Thursday’s all-time high of 8873.63, the cash (8848.52) jumped nearly 19 percent in three months. Right after Christmas, the daily RSI hit 80-plus, which closed last week at just under 69, but ended Monday at 71.4. Momentum has slowed but not reversed.
Last week, both bulls and bears put their foot down, with a weekly spinning top. Should bears prevail, nearest support lies at 8440s. By then, the Nasdaq 100 will have lost both the 10- and 20-day. Be that as it may, bulls for the last several weeks have bought dips around the 10-day, including Monday.
Russell 2000 mini-index: Currently net long 51.9k, up 11.1k.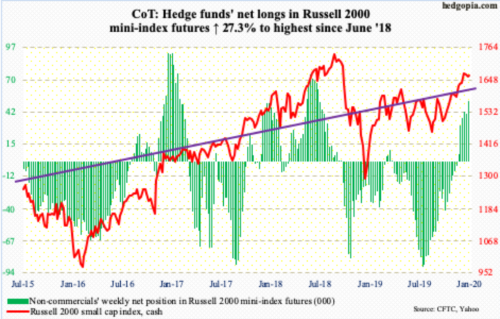
Once again, small-caps are beginning to lag large-caps. Last week, the cash (1663.26) suffered a back-to-back down week.
A month ago, the ratio of the Russell 2000 and the S&P 500 poked its head out of a falling trend line from June 2018. But small-cap bulls were unable to build on that. It is currently clinging on to four-month trend-line support (more on this here).
Nevertheless, the Russell 2000 remains comfortably above 1600-plus, which it broke out of late November. This was a crucial breakout. Bulls should be given the benefit of the doubt as long as the index is above this level.
US Dollar Index: Currently net long 12.1k, down 1.2k.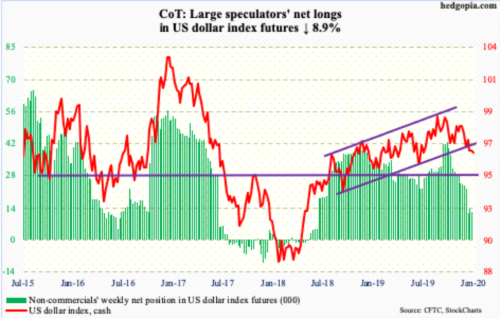
Early last week, the cash (96.35) proceeded to lose a rising trend line from September 2018, dropping to 96.02 intraday on New Year’s Eve. It then found some bids but only to end the week right at that trend line. Monday, the US dollar index fell 0.2 percent. Both the 10- and 20-day are still falling. In fact, sellers already showed up at the 20-day last Friday.
There is decent resistance at 96.80s. Above lie the 50- and 200-day (respectively 97.43 and 97.42), which approximate horizontal resistance at 97.50s.
VIX: Currently net short 152.9k, down 3.7k.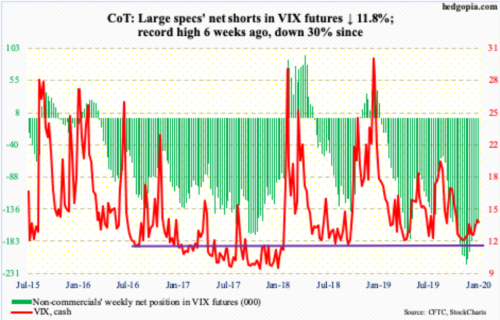
Last Friday was an interesting volatile session, with a range of 16.20 and 13.13, followed by Monday’s 16.39 and 13.54. In both sessions, the cash (13.85) was rejected at the 200-day (15.02) but found support at/near the 50-day (13.16). The latter is no longer sharply falling; the former already has a flattish look to it.
Importantly, last Friday’s session high tagged a falling trend line from last August when VIX retreated after printing 24.81. Since then, that resistance has repeatedly repelled rally attempts, including last week and Monday. The advantage volatility bulls have is that, because it is a downtrend line, the point at which a breakout will occur keeps falling as time progresses. A breakout, followed by higher highs, can change the volatility dynamics – duration and magnitude notwithstanding. The weekly MACD just formed a potentially bullish crossover.
Should VIX begin to rally, a potential tailwind can come from non-commercials, who in recent weeks have been cutting back but are still heavily net short VIX futures.
Thanks for reading!
