
Following futures positions of non-commercials are as of June 2, 2020.
10-year note: Currently net short 52.9k, up 14.9k.
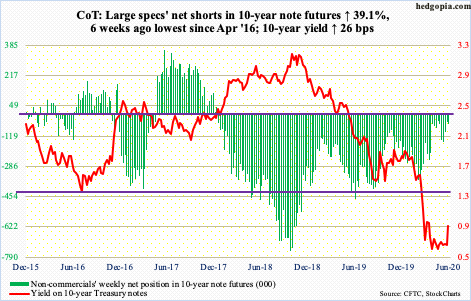
This week, the ECB surprised markets with its new bond purchase program (more below). The FOMC meets next week. But no one is expecting fireworks. In all probability, it is going to be one of those uneventful meetings.
In the press conference, the issue of negative interest rates will likely come up. Even here, unless Chair Powell does a 360, no newsworthy material will be forthcoming. He has repeatedly said the Fed is not interested in negative interest rates to counteract the Covid-19 recession. By the way, both the ECB and the BoJ are already there.
The fed has already done a lot. It has expanded its balance sheet to $7.2 trillion, up $2.9 trillion in just the last three months. During and after the 2007/2008 financial crisis, its unconventional measures included purchases of Treasury and mortgage-backed securities. This has now been expanded to also include corporate bonds, both investment-grade and junk. Markets are more than happy with the status quo. From central bankers’ perspective, why disturb the calm waters? If anything, what Powell says – or how he says it – about the 2.5 million non-farm jobs the economy created in May will be more pertinent. Will – or should – this lead the Fed to be less supportive?
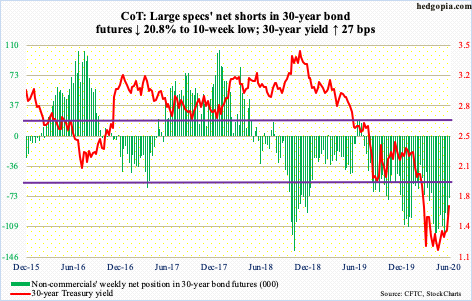
30-year bond: Currently net short 74.8k, down 19.7k.
Major economic releases next week are as follows.
On Tuesday, job openings (NFIB, May; JOLTS, April) are scheduled.
Small-business job openings tumbled 11 points month-over-month in April to 24, matching the low of September 2016.
March non-farm job openings tumbled 813,000 m/m to 6.19 million – the lowest since May 2017.
The consumer price index (May) comes out Wednesday. In April, headline and core consumer prices dropped 0.8 percent and 0.4 percent m/m, in that order. In the 12 months to April, they respectively rose 0.3 percent and 1.4 percent.
The producer price index (May) is on tap Thursday. Producer prices were down 1.3 percent m/m in April and down 1.2 percent in the 12 months to April. Core producer prices over the same time period declined 0.3 percent and rose 0.6 percent, respectively.
Friday brings the University of Michigan’s consumer sentiment index (June, preliminary). Consumer sentiment in May inched up 0.5 points m/m to 72.3. April’s 71.8 was the lowest since December 2011.
WTI crude oil: Currently net long 714.1k, up 14.8k.
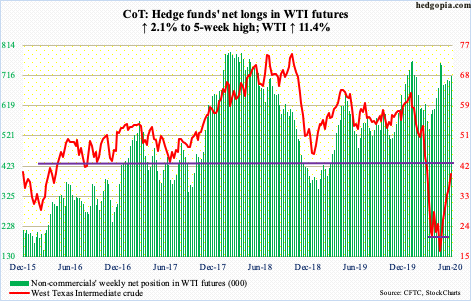
In April, OPEC+, comprised of OPEC and non-OPEC countries including Russia, agreed to cut crude output by 9.7 million barrels per day in May and June. They plan to meet Saturday to decide if this should be extended. Both Saudi Arabia and Russia reportedly are for an extension through the end of July. Markets have priced this in. Both WTI and Brent continued their rally this week, with the former jumping 11.4 percent.
WTI ($39.55/barrel) has now rallied for six weeks straight. It has come a long way since bottoming at $6.50 on April 21st. Momentum is intact. Although on the daily in particular, it is grossly extended. In ideal circumstances, bulls would love to fill a gap from early March at $41, which is a stone’s throw away.
In the meantime, according to the EIA, US crude production continued lower in the week to May 29th, down 200,000 b/d to 11.2 mb/d. Production peaked in February/March at 13.1 mb/d. Crude imports dropped as well, down one mb/d to 6.2 mb/d. As did crude stocks, which dropped 2.1 million barrels to 532.3 million barrels. Refinery utilization edged up five-tenths of a percentage point to 71.8 percent. Gasoline and distillate stocks, however, rose – up 2.8 million barrels and 9.9 million barrels to 257.8 million barrels and 174.3 million barrels, in that order.
E-mini S&P 500: Currently net short 225.8k, down 50.9k.
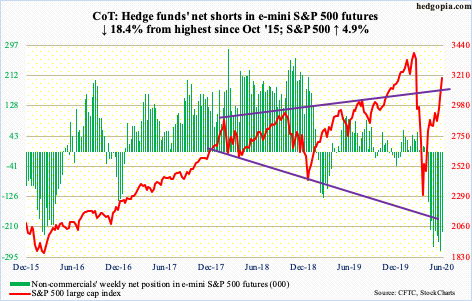
The status quo continues. Flows continue to disappoint, and the S&P 500 continues to rip higher.
In the week to Wednesday, another $4.6 billion came out of US-based equity funds, for six-week redemptions of $37.5 billion (courtesy of Lipper). In the same week, SPY (SPDR S&P 500 ETF), VOO (Vanguard S&P 500 ETF) and IVV (iShares Core S&P 500 ETF) collectively lost $2.3 billion (courtesy of ETF.com).
The S&P 500 (3193.93) does not bat an eyelid. Non-commercials, who were aggressively net short e-mini S&P 500 futures, helped, as they cut back. Their holdings are as of Tuesday. It is possible they cut back more as the S&P 500 rallied 3.7 percent in the next three sessions, including Friday’s 2.6-percent jump.
For the last three weeks, the index has rallied all along its rising daily lower Bollinger band. Sentiment remains effusive – even frothy (more on this here). But bulls hold the momentum card. There is gap-down resistance at 3250s from late February; the gap gets filled at 3320s.
Rather surprisingly, S&P 500 companies spent $198 billion in buybacks in the first quarter, up 9.3 percent sequentially. Given the uncertainty surrounding both stocks and the economy in that quarter, this should come as a nice surprise to equity bulls. It is probable buybacks begin to weaken beginning 2Q (more on this here).
Euro: Currently net long 81.2k, up 6k.
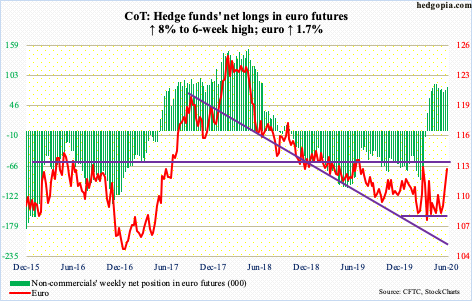
The ECB is increasing the size of its main pandemic-fighting bond purchase program by €600 billion, to €1.35 trillion. The Pandemic Emergency Purchase Program will run at least until the middle of next year. Its balance sheet is already €5.6 trillion strong, up €892 billion from mid-March. To deal with virus-ravaged economies, eurozone governments are expected to issue $1 trillion to €1.5 trillion in additional debt this year. The bank sees 2020 GDP shrinking 8.7 percent, but 2021 is expected to grow 5.2 percent. Last week, the European Commission proposed a €750-billion package to help the eurozone recover, although, unlike the ECB decision, it requires approval from the 27 national leaders and their parliaments. It is yet another instance of trying to solve a problem with debt, which in due course should lead to more debt-fueled crises.
The euro ($112.84) treated the ECB announcement Thursday with a 0.9 percent rally. For the week, it jumped 1.7 percent. This follows last week’s breakout from a two-month pennant. On March 9th, the euro retreated after tagging $114.85 intraday. So, this is a nice reference point to keep in mind. Longer-term, there is trend-line resistance around $117.50 from April 2008 when the currency peaked at $160.20.
The daily is way overbought. Nearest support lies at $111.70s.
Gold: Currently net long 219k, down 18.9k.
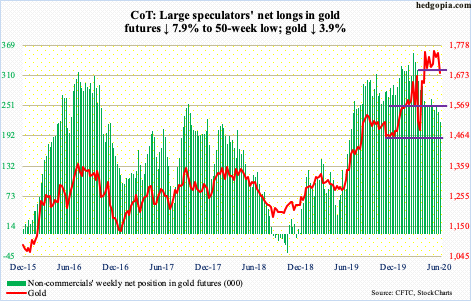
Same old, same old. Gold-focused ETFs continue to attract new money, the metal continues to move in a sideways pattern, and non-commercials continue to reduce net longs.
In the week to Wednesday, GLD (SPDR Gold ETF) and IAU (iShares Gold Trust) respectively took in $796 million and $237 million. This was the 11th straight week of positive flows, for combined inflows of $14.6 billion (courtesy of ETF.com).
Gold, on its part, once again failed to take out $1,750s. Monday’s intraday high of $1,761 kissed the daily upper Bollinger band. By Wednesday, it kissed the lower band, and by Friday it was clinging on to support at $1,700, or just below. This level has been like a line in the sand for three and a half months now. With non-commercials continuing to provide a headwind, breach risks are rising.
Nasdaq 100 index (mini): Currently net long 12.6k, up 9.2k.
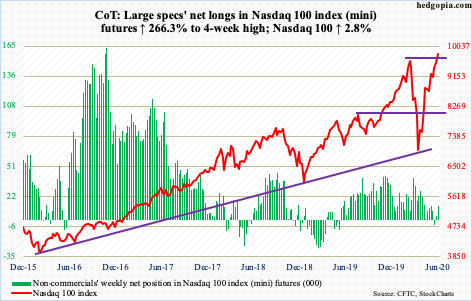
The Nasdaq 100 (9824.39) rose to a new high, just past the old high from February 19th. Leading up to this, $1.9 billion was withdrawn from QQQ (Invesco QQQ Trust) in the week to Wednesday. In the prior six weeks, the ETF took in $6.9 billion (courtesy of ETF.com).
In recent weeks, tech has continued to rally, but with decelerating momentum. That said, the index remains above all major averages, including the 10- and 20-day. Bears need to reclaim these shorter-term averages to begin to gain any traction.
Russell 2000 mini-index: Currently net long 16.5k, down 12.3k.
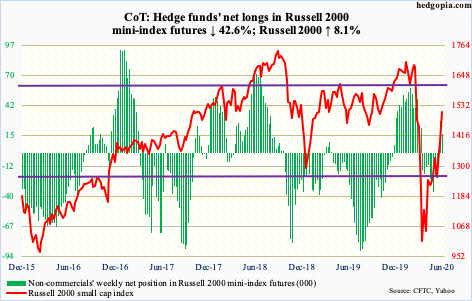
The two-session minor weakness last Thursday and Friday was short-lived. This week, the Russell 2000 jumped 8.1 percent. In the week through Wednesday, IWM (iShares Russell 2000 ETF) and IJR (iShares Core S&P Small-Cap ETF) respectively gained $93 million and $52 million (courtesy of ETF.com).
The Russell 2000 just retraced 61.8 percent of its February-March decline, which lies at 1419 (more on this here). Both the S&P 500 and Nasdaq 100 went sideways after they achieved their similar Fibonacci retracement. Not much consolidation on the Russell 2000 (1507.15) unfolded after the retracement. It is a long way from here, but bulls would love to test 1600, which has proven to be a crucial price point for both bulls and bears.
US Dollar Index: Currently net long 8.3k, down 6.5k.
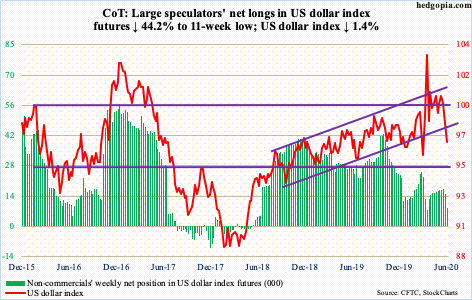
The US dollar index (96.92) fell apart this week – sort of. Dollar bulls did not even put up a good fight around 97.50s, which consisted of dual support – straight line and lower bound of a two-year rising channel. It was lost Wednesday and on Thursday sellers showed up exactly at that broken-support-turned resistance.
The daily is oversold. If things do not stabilize here soon, risks rise of a test of important support at 95.
VIX: Currently net short 52.7k, up 10k.
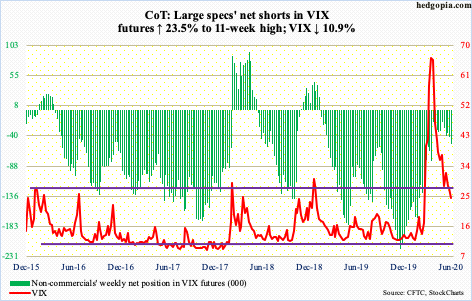
For the first time since February 19th, VIX (24.52) lost the 200-day (24.55), albeit only slightly. Earlier on Monday, the volatility index was sold at the 20-day, which, along with the 10-day, has resisted rally attempts for a while now. A decisive loss of the 200-day exposes it to a possible test of 19-20.
VIX is testing this crucial support at a time when sentiment is increasingly getting frothy in options. For 15 straight sessions, the CBOE equity-only put-to-call ratio produced readings of 0.40s and 0.50s, with all five sessions this week registering 0.40s. The 21-day moving average of the ratio ended Friday at 0.523, even as the 10-day closed at 0.486. This is greed territory – hands down. It never ends well when bullish sentiment is this lop-sided.
Thanks for reading!
