
Following futures positions of non-commercials are as of June 9, 2020.
10-year note: Currently net long 2.3k, up 55.2k.
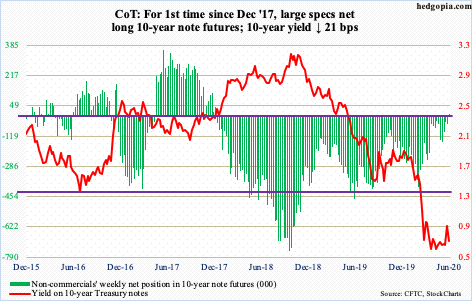
Post-conclusion of FOMC meeting, Fed Chair Jerome Powell Wednesday sought to play down May’s much-better-than-expected jobs report, which showed the economy produced 2.5 million non-farm jobs, versus expectations of a loss of 7.5 million. His message: a long road lies ahead. This runs in counter to how President Donald Trump sees things, saying the economy will be back and better than ever next year. It is his administration, and it is an election year. It makes sense for him to sound optimistic. Powell, on the other hand, was simply stating his professional take on where things stand. Thus far, the bond market agrees with him.
Last Friday, the 10-year yield (0.7 percent) rallied to 0.96 percent intraday – the first time it got closer to one percent since March 20th – before coming under pressure in the next four sessions. Thursday, it tagged 0.65 percent, losing support at 0.75 percent. For three months now, bond bears (on price) have defended 0.59 percent, a loss of which raises downside risks. On March 9th, the 10-year dropped to 0.4 percent intraday.
Non-commercials are beginning to position for lower rates. For the first time since December 2017, they went net long 10-year note futures this week.
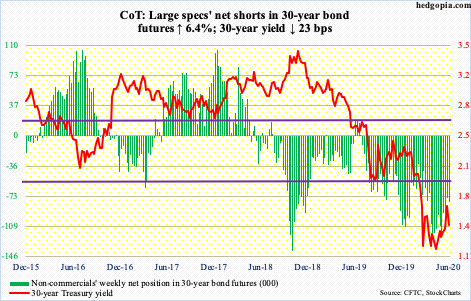
30-year bond: Currently net short 79.6k, up 4.8k.
Major economic releases next week are as follows.
Treasury International Capital data (April) will be published Monday. In the 12 months to March, foreigners purchased $83.5 billion in US equities. This is quite a reversal from April last year when they sold $214.6 billion worth – a record.
Tuesday, retail sales (May), industrial production (May) and the NAHB housing market index (June) come out.
In April, retail sales fell 16.5 percent month-over-month and 21.6 percent year-over-year to a seasonally adjusted annual rate of $403.9 billion. Sales peaked in January at $529.6 billion.
Capacity utilization in April dropped 8.3 percentage points m/m to 64.9 percent – an all-time low (data goes back to January 1967).
Homebuilder confidence increased seven points in May from April’s 30, which was the lowest since June 2012. Last December, it hit 76.
Housing starts (May) are due out Wednesday. Starts tumbled 30.2 percent m/m in April to 891 units (SAAR). This was the lowest since February 2015.
WTI crude oil: Currently net long 712.3k, down 1.8k.
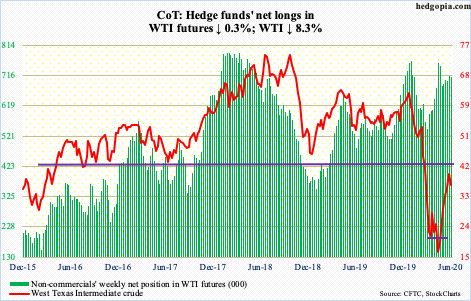
OPEC+, comprised of OPEC and non-OPEC countries including Russia, agreed to extend the existing agreement through July. In April, these producers agreed to cut crude output by 9.7 million barrels per day in May and June. Originally, production was set to rise in steps after June.
On Monday, markets’ initial reaction was favorable. WTI ($36.26/barrel) tagged $40.44 intraday, just about kissing the daily upper Bollinger band. More importantly, the gap from three months ago was essentially filled. Then, sellers showed up. On the weekly, the RSI turned back down from the median. Conditions are overbought. Nearest support lies at $28-29.
The EIA report for the week to June 5th showed refinery utilization rose 1.3 percentage points to 73.1 percent. Inventories, however, rose across the board, with crude, gasoline and distillate stocks up 5.7 million barrels, 866,000 barrels and 1.6 million barrels to 538.1 million barrels, 258.7 million barrels and 175.8 million barrels, in that order. Crude imports rose as well, up 685,000 b/d to 6.9 mb/d. Crude production continued lower, down 100,000 b/d to 11.1 mb/d. Production peaked in February/March at 13.1 mb/d.
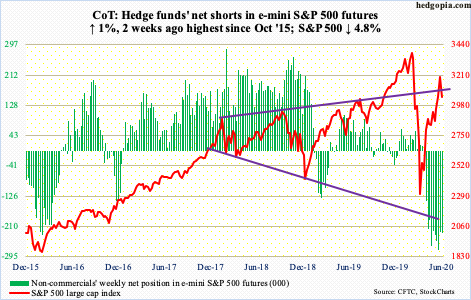
E-mini S&P 500: Currently net short 228..2k, up 2.3k.
In the prior six weeks, $37.5 billion moved out of US-based equity funds. Stocks were ripping higher during this period. This week – in the week to Wednesday – $20.4 billion came in (courtesy of Lipper). In the same week, SPY (SPDR S&P 500 ETF), VOO (Vanguard S&P 500 ETF) and IVV (iShares Core S&P 500 ETF) collectively gained $8.4 billion (courtesy of ETF.com). They came in just before the rug was pulled out from underneath stocks.
On Thursday, the S&P 500 (3041.31) tumbled 5.9 percent, for a weekly loss of 4.8 percent. Three sessions ago, the index tagged 3233.13, which was merely five percent from the February 19th all-time high of 3393.52. The subsequent February-March collapse bottomed on March 23rd at 2191.86. From that low, it shot up 47.5 percent in two and a half months, sending several indicators into frothy territory.
On Monday, 97.8 percent of S&P 500 stocks were above their 50-day (more on this here). In March, this metric languished at one percent. This week, Investors Intelligence bulls rose to 56.9 percent, higher than the 54.7 percent in the week to February 18th.
Continued unwinding is the path of least resistance. Currently, bulls are trying to defend the 200-day (3013.88). Once that gives way, next support lies at 2950s, and 2760s after that.
Euro: Currently net long 95.6k, up 14.4k.
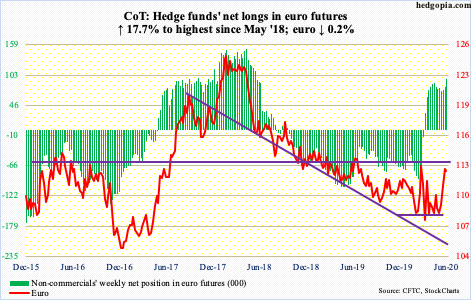
In a spinning top session on March 9th, the euro ($112.57) hit $114.85 intraday before coming under sustained pressure to ultimately bottom at $106.35 on March 20th. Once again, in a spinning top session this Thursday the currency printed $114.25 intraday before coming under pressure. The weekly candle had a tall shadow this week. This comes after three positive weeks and a pennant breakout two weeks ago.
The euro Friday lost the 10-day but remains above the 20. Both are still rising, but odds favor they begin a process of rolling over in the sessions ahead. Bulls’ mettle will be tested at $111.70s-80s.
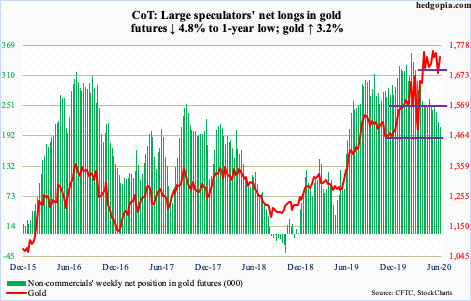
Gold: Currently net long 208.6k, down 10.4k.
For the first time in 12 weeks, GLD (SPDR Gold ETF) bled this week, losing $188 million in the week to Wednesday. On IAU (iShares Gold Trust), however, the streak continued, with the ETF gaining $241 million (courtesy of ETF.com).
In the meantime, gold ($1,737.30/ounce) continued on its sideways journey. Last Friday, the metal tagged $1,671.70. For nearly four months now, $1,700, or just below, has persistently attracted bids. This occurred again, as the metal hit $1,754.90 intraday Thursday; this was a massively risk-off session, so one would think gold bugs would be able to break through $1,750s – did not happen. The back-and-forth action continues.
After this week’s action in equities and increasing odds of continued unwinding, gold should be able to generate interest. A lack thereof will be a big tell. Non-commercials’ net longs are at a one-year low.
Nasdaq 100 index (mini): Currently net long 10.2k, down 2.4k.
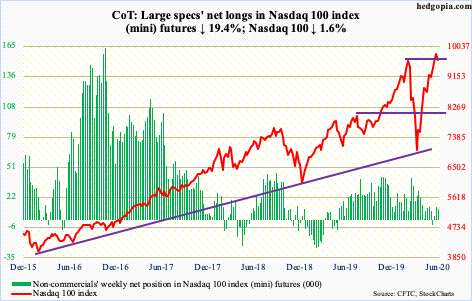
No sooner than the February 19th record high was surpassed than it was lost. Last Friday, the prior intraday high of 9736.57 was taken out. This week, bulls built on it further by rallying the Nasdaq 100 (9663.77) to 10155.20 intraday Wednesday. Thursday, it collapsed five percent to be pushed back under the old high.
Before Thursday’s tumble, QQQ (Invesco QQQ Trust) gained $732 million in the week to Wednesday (courtesy of ETF.com). Of the top five stocks, with the exception of Alphabet (GOOG/L), the remaining four – Apple (AAPL), Microsoft (MSFT), Amazon (AMZN) and Facebook (FB) – all posted new highs this week before coming under pressure. How they behave will obviously have a bearing on a cap-weighted index. As is the Nasdaq 100, they are all extended in their own right.
Overall, conditions remain overbought. Nearest support lies at 9200.
Russell 2000 mini-index: Currently net long 10.4k, down 6.1k.
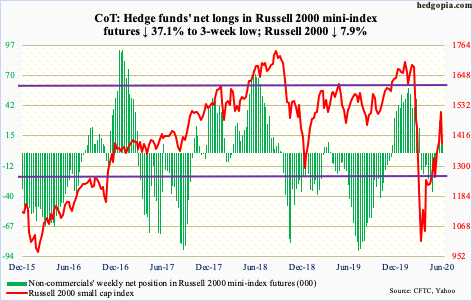
Last week, the Russell 2000 (1387.68) surged 8.1 percent, breaking out of resistance at 1450s-60s. This raised hopes that the next stop would be a test of 1600, which has proven to be an important price point going back to January 2018. In the week to Wednesday this week, IWM (iShares Russell 2000 ETF) and IJR (iShares Core S&P Small-Cap ETF) respectively gained $657 million and $1.3 billion (courtesy of ETF.com).
Small-cap momentum soon petered out. On Monday, the Russell 2000 hit 1537.62, before sellers crawled out of the woodwork. By Wednesday, the index was clinging on to 1450s-60s and by Thursday 1330s was tested (more on this here). So far, the test has been successful, but odds favor the index continues lower, with 1250s next support.
US Dollar Index: Currently net long 4.7k, down 3.6k.
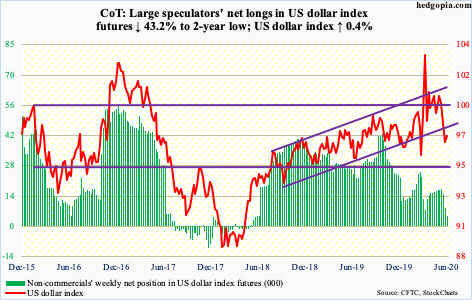
Support just north of 95 goes back over five years. Intraday Wednesday, the US dollar index (97.33) dropped to 95.71 to kiss the daily lower Bollinger band. That low was bought. The daily is itching to rally. The 10-day was reclaimed Friday. Once 97.50s gives way, bulls will be eyeing the 200-day at 98.34.
VIX: Currently net short 67.5k, down 14.8k.
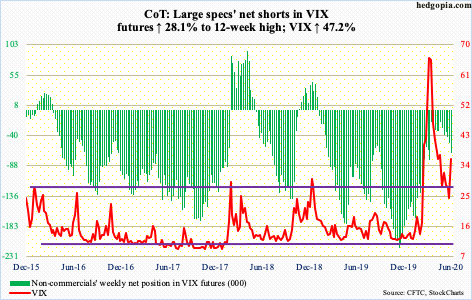
The 200-day was defended both last week and early this week. Thursday, VIX (36.09) shot up 48 percent to the highest since April 22nd. Daily Bollinger bands are looking to open up, and there is room for the weekly to continue higher. Should the daily come under pressure, the 50-day lies at 34.41, which was kind of tested Friday. Just above lies horizontal support at 36-37. These levels should hold for volatility bulls to get traction. The caveat near term is that the daily is getting extended.
Thursday’s spike in VIX came after persistent optimism shown by equity bulls in the options market. In three out of five sessions ended Tuesday, the CBOE equity-only put-to-call ratio produced readings of 0.30s. Before this, the last 0.30s reading was recorded six years ago (more on this here). Consequently, the 21-day average tumbled to 0.505 on Wednesday, which just about matched the low of January 17th. Also on Wednesday, the 10-day average printed 0.451, which was the lowest since December 2010. These are not normal readings. Bulls are giddy. This never ends well.
Thanks for reading!
