
Following futures positions of non-commercials are as of June 23, 2020.
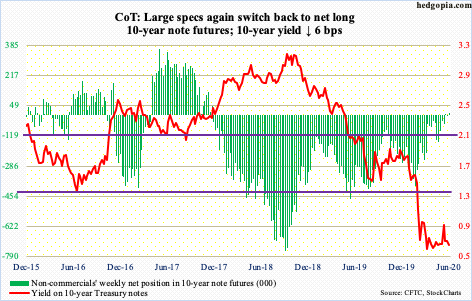
10-year note: Currently net long 6.5k, up 17.4k.
The Federal Reserve continued to reduce its assets this week. Since rising to a record $7.17 trillion two weeks ago, the balance sheet has contracted by $86.6 billion – $12.4 billion this week and $74.2 billion before that. This preceded 15 consecutive weeks of expansion during which the balance sheet grew by $3.01 trillion.
Risk-on assets, like equities, rallied strongly on this. If the recent trend of contraction sustains, one wonders how they will behave.
SOMA (System Open Market Account) holdings, however, continue to rise. This week (as of Wednesday), they rose $53.2 billion to $6.11 trillion. This is much slower than the $433.7-billion pace in the week to April 1st, but an increase all the same.
Potentially important for the long end of the yield curve is continued accumulation of Treasury notes and bonds. This week, the Fed purchased $28.5 billion worth, to $3.56 trillion. Even here, there is deceleration, with purchases of as much as $335.7 billion in the week to April 1st.
This is obviously important for the 10-year Treasury yield, which fell six basis points this week to 0.64 percent. The Fed wants rates to remain low, and they have cooperated. The last time the 10-year yielded more than a percent was on March 20th. Thus the question, can the Fed continue on its current path of decelerating asset purchases?
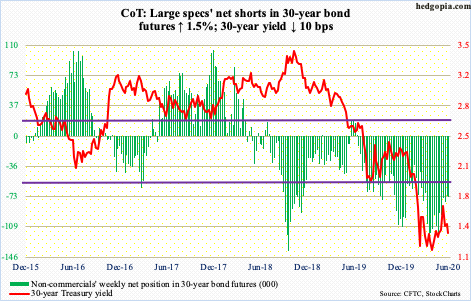
30-year bond: Currently net short 73.4k, up 1.1k.
Major economic releases next week are as follows. Friday is closed for observance of Independence Day, which falls on Saturday.
The S&P Case-Shiller home price index (April) is due out Tuesday. Nationally, US home prices appreciated 4.4 percent year-over-year in March. This was the fastest pace of appreciation in 15 months.
The ISM manufacturing index (June) and FOMC minutes (June 9-10 meeting) are scheduled for Wednesday.
Manufacturing activity in May rose 1.6 points month-over-month to 43.1. April’s 41.5 was an 11-year low.
Thursday brings nonfarm payrolls (June) and durable goods orders (May, revised).
In March and April, the US economy lost 22.1 million non-farm jobs to 130.4 million, which was the lowest total since October 2010. May then added 2.5 million jobs.
Preliminarily in May, non-defense capital goods ex-aircraft – proxy for business capex plans – increased 2.3 percent m/m to a seasonally adjusted annual rate of $62.7 billion. In January, orders were $66.8 billion.
WTI crude oil: Currently net long 680.9k, up 3.6k.
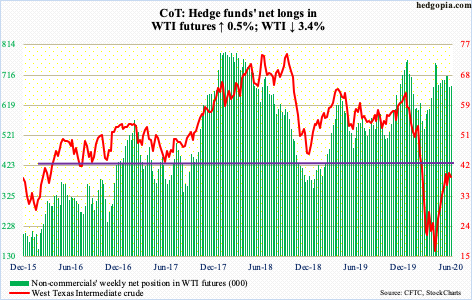
WTI ($38.49/barrel) further filled the gap from early March this week. Tuesday’s intraday high of $41.63 also kissed the daily upper Bollinger band before coming under slight pressure. There is also horizontal support just north of $42 going back several years.
Concurrently, the weekly RSI seems to want to head back lower from the median. Both the 10- and 20-day moving averages have flatlined and could be itching to roll over. The daily Bollinger bands have tightened, which could precede a sharp move – either up or down.
The crude has had quite a rally since bottoming at $6.50 on April 21st. A rising trend line from that low was breached Wednesday. Unless oil bulls act fast, momentum could shift bears’ way. Nearest support lies at $34; a breach opens the door to a test of $28-29.
In the week to June 19th, US crude production increased 500,000 barrels per day to 11 million b/d. This was the first week-over-week rise in 16 weeks. Production peaked in February/March at 13.1 mb/d. Crude and distillate stocks rose as well – up 1.4 million barrels and 249,000 barrels respectively to 540.7 million barres – a record – and 174.7 million barrels. Gasoline stocks, however, dropped 1.7 million barrels to 255.3 million barrels. Refinery utilization inched up eight-tenths of a percentage point to 74.6 percent. Crude imports fell as well – down 102,000 b/d to 6.5 mb/d.
E-mini S&P 500: Currently net short 97.1k, down 206.2k.
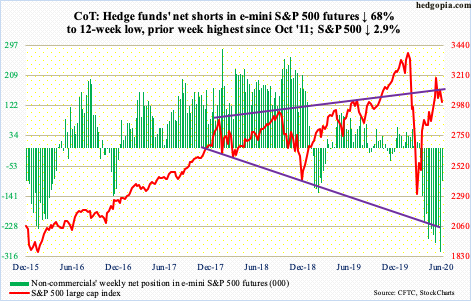
Bulls continued to struggle to fill the gap from June 10th at 3181. Tuesday, the S&P 500 large cap index (3009.05) tagged 3154.90 before selling began. For a couple of weeks now, bulls have struggled at 3150s. In the subsequent selling, the 200-day (3020.94) was slightly breached Friday, which likely opens the door to a test of 2950s, which was defended two weeks ago. The 50-day at 2980.07 lies around there as well. This is a make-or-break for now.
Bulls were hoping to squeeze non-commercials who had accumulated massive net shorts in e-mini S&P 500 futures. This week, these holdings got cut down big time.
As far as flows were concerned, US-based equity funds bled another $5 billion in the week to Wednesday. In the last nine, eight saw outflows, for combined outflows of $47.6 billion (courtesy of Lipper). In the same week, SPY (SPDR S&P 500 ETF), VOO (Vanguard S&P 500 ETF) and IVV (iShares Core S&P 500 ETF) collectively took in $6.5 billion (courtesy of ETF.com).
At the same time, outflows from money-market funds pretty much trickled to a stop this week. In the week to Wednesday, merely $1.6 billion left, to $4.7 trillion. In the prior four, $104.7 billion came out (courtesy of ICI). Equity bulls have hoped for a while that things would evolve this way and that stocks got their fair share, which is yet to happen in earnest (more on this here).
Euro: Currently net long 118.4k, up 1.3k.
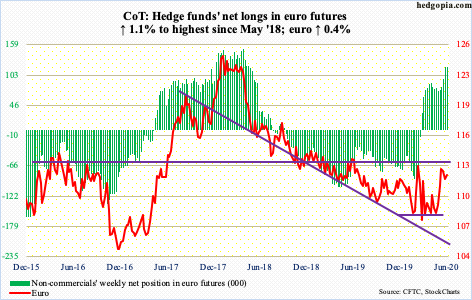
Bulls tried to reclaim the 10- and 20-day, which they did by rallying the euro ($112.19) to $113.50 intraday Tuesday, but in the end that session ended in a shooting star. The next session, the currency gapped lower, proceeding to lose the averages on Thursday.
From bulls’ perspective, the good thing is that support at $111.70s-80s attracted bids on Thursday. A loss of this probably ensures a move toward $110, where a confluence of support lies – the 200-day at $110.36, the 50-day at $110.38 and horizontal just under $110.
Gold: Currently net long 252k, up 27.6k.
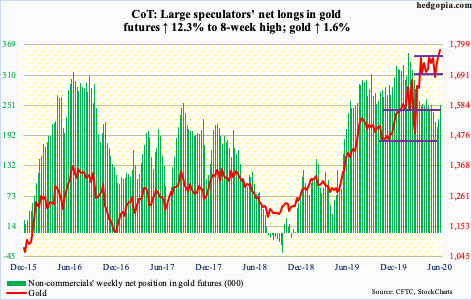
Gold bugs had their share of both good and bad news this week. Wednesday’s high of $1,796.10 surpassed the April 14th high of $1,788.80 intraday but the session was unable to hang on to the gains, ending down 0.4 percent. The good thing is that this unfolded above $1,750s, which gold ($1,780.30/ounce) was unable to break out of in the prior 11 weeks.
For the week, the metal advanced 1.6 percent. Flows were in full cooperation. GLD (SPDR Gold ETF) in the week to Wednesday gained $2.3 billion and IAU (iShares Gold Trust) $237 million (courtesy of ETF.com).
Non-commercials have now added to their net longs for two weeks in a row.
The daily is overbought. Bulls would love if this gets unwound more through time than price, preferably above $1,750s, or between $1,700 and $1,750s.
Nasdaq 100 index (mini): Currently net long 39k, up 13.8k.
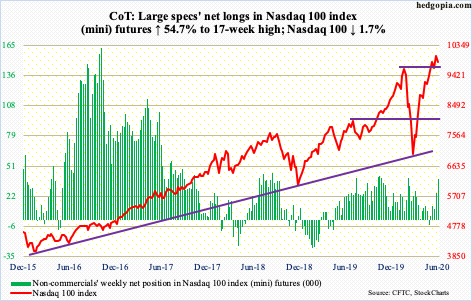
In the week to Wednesday, QQQ (Invesco QQQ Trust) lost $71 million (courtesy of ETF.com). In the prior two, $1.8 billion came in.
Tuesday, the Nasdaq 100 (9849.36) printed a new intraday high of 10306.90, but by close a shooting star formed. By Friday, the 10- and 20-day (10002.35 and 9882.68 respectively) were lost – the latter only slightly. This is an opening for bears. Let us see if they can cash in on it. Before this week, bulls had not lost these averages for over two and a half months.
Russell 2000 mini-index: Currently net long 5.7k, down 3.2k.
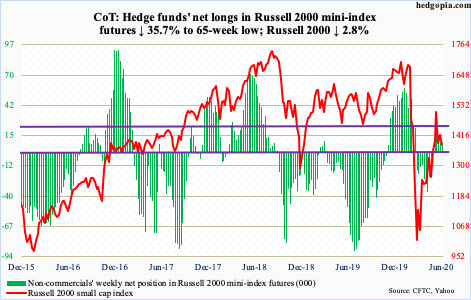
In the week to Wednesday, IWM (iShares Russell 2000 ETF) and IJR (iShares Core S&P Small-Cap ETF) respectively gained $326 million and $133 million (courtesy of ETF.com). Nevertheless, choppy action continued.
The Russell 2000 (1378.78) Tuesday was denied at 1450s, which has proven to be an important price point for nearly three years now. In early March, bears seized momentum after 1450s gave way. The February-March collapse bottomed at 966.22 on March 18th. The subsequent rally peaked at 1537.62 on June 8th. To get there, the index obviously broke out of 1450s, but it was short-lived.
This week’s unsuccessful attempt at that ceiling then quickly led to a successful test of channel support from the March bottom. Both Wednesday and Thursday, 1370s was bought. Support at 1330s was not even tested. For now, consolidation continues – between 1450s and 1330s – even as earnings estimates continue their downward spiral, particularly for this year (more on this here). Risk remains to the downside.
US Dollar Index: Currently net short 5.3k, down 30.
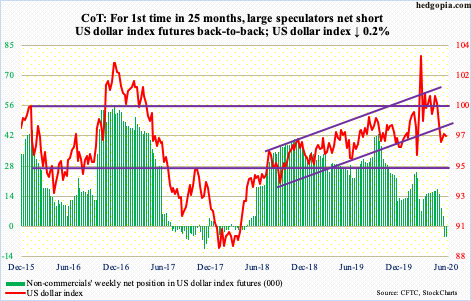
The June 10th intraday low of 95.71 kissed the daily lower Bollinger band. Support just north of 95 also goes back over five years. Immediately thereafter, support at 97.50s was tested – unsuccessfully. Since then, bulls tried to reclaim this level several times, including Friday, but to no avail. Odds favor bulls will prevail eventually.
On the weekly, this was the third week in a row that the US dollar index ended up with a hammer. On the daily, a potentially bullish crossover just took place between the 10- and 20-day. After 97.50s is recaptured, the 200-day lies at 98.27.
VIX: Currently net short 63.1k, up 11.3k.
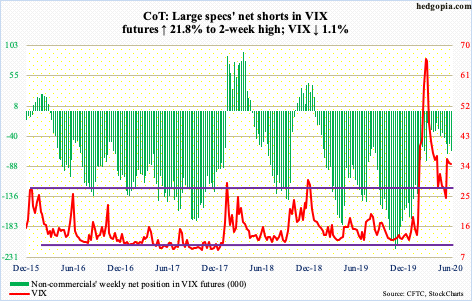
VIX this week defended both the lower and upper end of its recent range. Intraday Tuesday, it fell to 29.26. There is decent support at mid- to high-20s. Then intraday Wednesday, it tagged 37.12. For the past couple of months, rally attempts have gotten rejected at 36-37.
In the first half this month, VIX (34.73) rallied past 36-37, rising all the way to 44.44 on the 15th, but volatility bulls were unable to build on that. But at the same time, support has held. The action this week was kind of strange in that both VIX and the S&P 500 were down.
Elsewhere in the options market, the 21-day moving average of the CBOE equity-only put-to-call ratio dropped Tuesday to 0.494 – the lowest since January 2011 – before beginning to rise, with Friday at 0.524. A sustained push higher will not be liked by stocks. Historically, the current readings are too complacent. Bulls are giddy – plain and simple.
Thanks for reading!
