
Following futures positions of non-commercials are as of July 14, 2020.
10-year note: Currently net long 58.1k, up 14.9k.
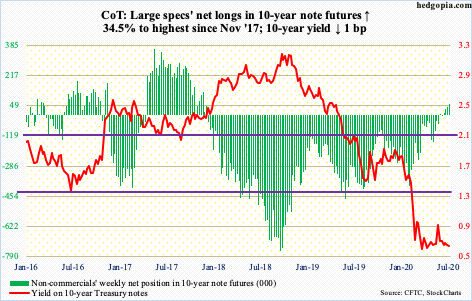
The 10-year Treasury yield (0.63 percent) continues to bounce along the lower bound of a four-month range between 0.73 percent and 0.59 percent. The 10- and 20-day moving averages – both slightly falling – continue to reject rally attempts. Rates rose as high as 0.66 percent Monday, while 0.60 percent was tagged Tuesday, Thursday and Friday.
In the meantime, daily Bollinger bands continue to narrow. More often than not, this is preceded by a sharp move – either up or down. Non-commercials, who have now been net long 10-year note futures in five of the last six weeks, are increasingly betting that the break will be to the downside.
Of note, before this, these traders remained net short for a long time – from late December 2017 to early June, betting on higher rates. They were right until October 2018 when the 10-year peaked at 3.25 percent. In September that year, they were net short 756,316 contracts. As they covered, the 10-year continued lower, until it tagged 0.4 percent on March 9 this year.
This time around, these traders have just begun to accumulate net longs – likely not enough for a contrarian to consider taking the other side.
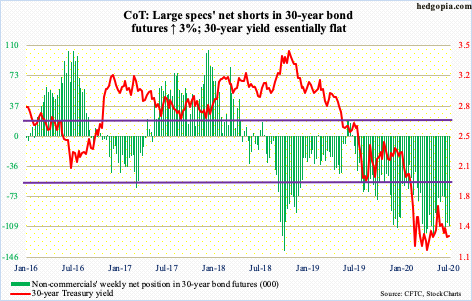
30-year bond: Currently net short 108.3k, up 3.2k.
Major economic releases next week are as follows.
Existing home sales (June) are due out Wednesday. Sales fell 9.7 percent month-over-month in May to a seasonally adjusted annual rate of 3.91 million units. From February’s 5.76 million, sales are down 32.1 percent.
Friday brings new home sales (June). In May, sales jumped 16.6 percent m/m to 676,000 units. Earlier, April’s 580,000 was down 25.1 percent from January’s 774,000 units.
WTI crude oil: Currently net long 654.6k, up 11k.
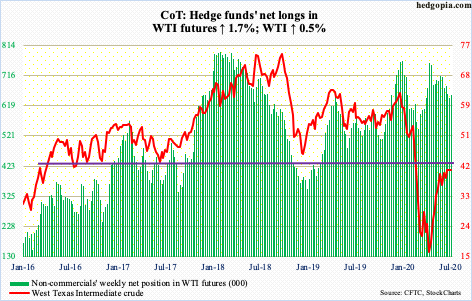
WTI ($40.75/barrel) continues to coil between the 50- and 200-day (respectively at $36.32 and $43.79). Less than 3.5 points separate the daily Bollinger bands. The crude is acting this way even as it filled a gap from early March, having rallied massively after it bottomed at $6.50 on April 21. Both the 10- and 20-day have flatlined. At this point in time, it increasingly feels like it is bulls’ ball to lose. They were also unable to cash in on what looked like a favorable EIA report for the week to June 10.
US crude production was flat at 11 million barrels per day and has been flat the past four weeks. Stocks dropped across the board – crude down 7.5 million barrels to 531.7 million barrels, gasoline down 3.1 million barrels to 248.5 million barrels and distillates down 453,000 to 176.8 million barrels. Refinery utilization edged up six tenths of a percentage point to 78.1 percent. Crude imports were down 1.8 mb/d to 5.6 mb/d.
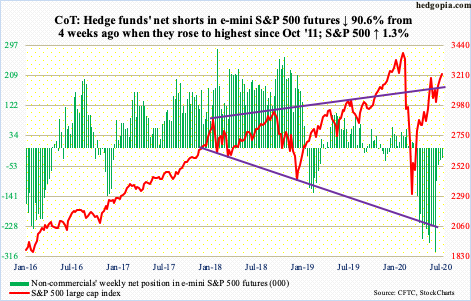
E-mini S&P 500: Currently net short 28.6k, down 7.6k.
In the week to Wednesday, money market funds dropped $87.4 billion to $4.57 trillion (courtesy of ICI). Since peaking in the week to May 20, they are now down $221 billion. Equity bulls were treating the massive buildup in these assets as dry powder. But thus far, things have not quite panned out that way. In the past eight weeks, $38 billion came out of US-based equity funds, including this week’s $8.9 billion (courtesy of Lipper). In the week to Wednesday, SPY (SPDR S&P 500 ETF), VOO (Vanguard S&P 500 ETF) and IVV (iShares Core S&P 500 ETF) collectively lost $2.7 billion (courtesy of ETF.com).
Last week’s 3150s breakout on the S&P 500 (3224.73) was unable to lure in flows; the July 6th breakout also filled a gap from June 11. This was followed by a few more days of sideways action before bulls went after the June 8th high of 3233.13. Monday, the S&P 500 rallied to 3235.32 intraday but only to reverse strongly lower. Wednesday, it tagged 3238.28 intraday in a doji session. Friday, in another doji session, it touched 3233.52 intraday. Resistance is normal around this level. The index has essentially gone sideways for six weeks. Some signs of distribution appeared this week, but bulls are yet to let go of the prevailing momentum.
They should be more than happy how foreigners have been accumulating US stocks. In the 12 months to May, they purchased $157.3 billion worth, which was a 10-year high. This is higher than in January 2018 when the 12-month total of $135.6 billion was recorded just before the S&P 500 reversed sharply lower (chart here).
Euro: Currently net long 110.9k, up 7.3k.
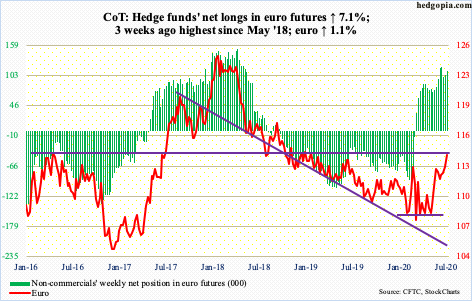
The ECB is maintaining the status quo, continuing with the Pandemic Emergency Purchase Program, which was expanded last month by €600 billion to €1.35 trillion and which runs through the middle of next year.
Thursday, the day the ECB announced its decision, the euro ($114.28) fell 0.3 percent, having failed in its attempt to rally intraday. Before this, it finished poorly Wednesday after tagging $114.55 intraday. On March 9, the currency reversed strongly lower after touching $114.85. This level is expected to act as resistance, and it has.
Non-commercials are positioned as if a breakout is just a matter of time.
Gold: Currently net long 262.4k, down 4.9k.
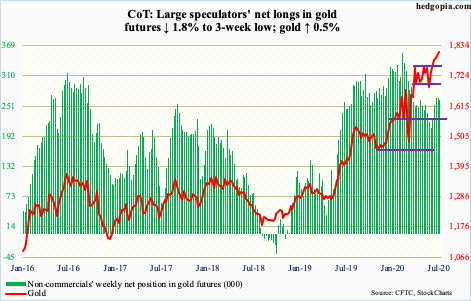
Money continued to flow into gold-focused ETFs, with GLD (SPDR Gold ETF) gaining $271 million and IAU (iShares Gold Trust) $388 million in the week to Wednesday (courtesy of ETF.com).
Gold ($1,810/ounce) is trading sideways at best and showing subtle signs of fatigue at worst. On March 16, the metal bottomed at $1,450.90, before gradually rallying past one after another resistance, including the 50- and 200-day.
Four weeks ago, after trying for 11 straight weeks, gold broke out of $1,750s, subsequently tagging $1,829.80 on July 8. Since that high, it has stalled – even struggled. Unless gold bugs act fast next week, the yellow metal risks losing the 10- and 20-day, in which case a test of $1750s, or $1700 in a worse case, is the path of least resistance.
Nasdaq 100 index (mini): Currently net long 35.6k, down 9.1k.
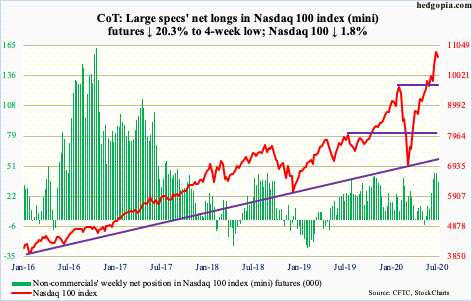
In the week to Wednesday, QQQ (Invesco QQQ Trust) lost $2 billion, as opposed to inflows of $3.6 billion in the prior week (courtesy of ETF.com).
Monday’s new intraday high of 11069.26 on the Nasdaq 100 came in a bearish engulfing session. This preceded a shooting star on Tuesday and a hanging man on Thursday last week. On the weekly, the RSI just turned back down from above 70. A decent opportunity could be setting up for bears.
Conditions are overbought – on the daily and weekly timeframe in particular. In 10 sessions through Monday’s high, the Nasdaq 100 (10645.22) shot up 13.6 percent intraday; the low on June 29 was a successful test of the prior high from February. This will get retested around 9800.
Russell 2000 mini-index: Currently net long 4.5k, down 2.9k.
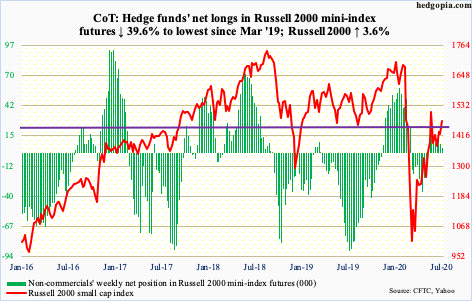
After several attempts since late May, bulls finally pushed through horizontal resistance at 1450s on the Russell 2000. Volume was not in cooperation, however. This was preceded by defense of the 50-day for several sessions. When the breakout occurred on Wednesday, the 200-day was reclaimed as well. It is possible shorts lent a helping hand. At the end of June, IWM (iShares Russell 2000 ETF) short interest jumped 30 percent period-over-period to 124 million shares.
Small-cap bulls would rather want Wednesday’s breakout was the result of more investors beginning to buy into next year’s earnings outlook. As of last Wednesday, the sell-side expected S&P 600 companies to lose $4.25 this year but earn $43.05 next year! As difficult as it is to buy into this pie-in-the-sky outlook, if next year’s elevated optimism indeed comes through, then it is easy to see why the Russell 2000 (1473.32) would want to reclaim 1450s and head higher (more on this here).
Be that as it may, bears refuse to turn tail. They are probably looking for more evidence of achievability of next year’s earnings outlook. Both Thursday and Friday, they forced a retest of Wednesday’s breakout, which was defended.
US Dollar Index: Currently net short 5k, up 100.
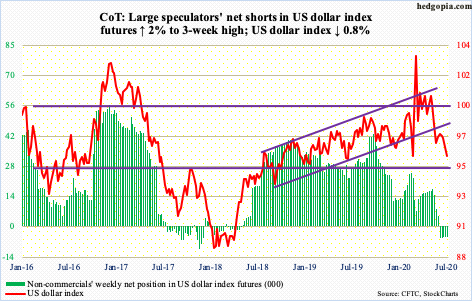
In the last two weeks, the 10-day consistently came in the way of rally attempts. After getting denied at 97.50s for several sessions late last month, the US dollar index trended lower until Wednesday when the intraday low of 95.79 essentially tested the June 10th low of 95.70. Support around this level goes back at least five years.
The US dollar index (95.86) ended the week clinging on to that support. Should it hold, a crucial test lies ahead. Around 96.70s lies a falling trend line from March 23 when the index peaked at 103.96.
VIX: Currently net short 88.4k, up 9.9k.
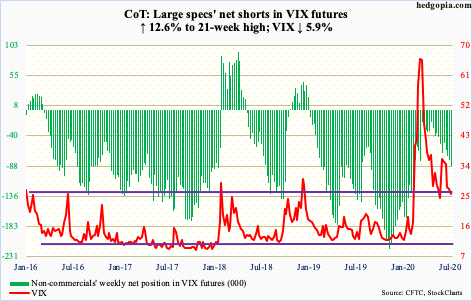
For two weeks now, except for a few sessions, VIX (25.68) was drawn to its 200-day like a magnet. Kudos to volatility bulls for persistently defending the average – until Friday, that is, when the average (26.63) was breached.
On March 18, VIX retreated after printing 85.47 intraday. A trend line drawn from that high extends to just north of 30. Early this week, rally attempts were repeatedly denied at this resistance, which approximates the 50-day at 30.06. For now, this is the one to watch. After that comes 36-37, which, should it fall, will have significantly raised the odds of higher volatility.
But before that happens, volatility bulls cannot afford to decisively lose mid-20s. Now that the 200-day is breached, non-commercials are eyeing that possibility. Net shorts are at a 21-week high.
Thanks for reading!
