Following futures positions of non-commercials are as of July 28, 2020.
10-year note: Currently net long 73.2k, up 44.1k.
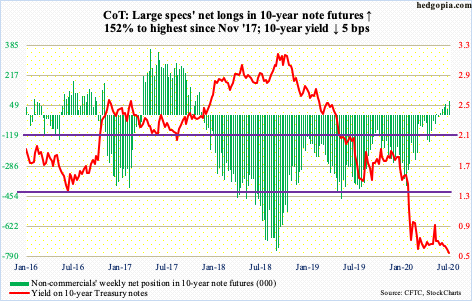
The 10-year treasury yield lost five basis points this week to 0.54 percent. Five-month support at 0.57 percent has been breached.
Rates began to go sideways soon after they dropped to 0.4 percent on March 9. They have not been above one percent since March 20.
For bond bulls (on price) looking for reasons to feel bullish, 2Q20 GDP and FOMC meeting acted as catalysts this week. Real GDP contracted at a 32.9 percent annual rate last quarter, while the Fed stuck to its dovish message.
With the amount of leverage in the system, rates are not in a position to sustainably rally. The Fed knows this and would like lower rates. US national debt itself is $26.6 trillion – and headed a lot higher given the soaring budget deficit; nominal GDP just contracted to $19.4 trillion.
This fact is probably what led non-commercials to switch to net longs in 10-year note futures seven weeks ago. In all probability, the buildup phase is in its early innings.
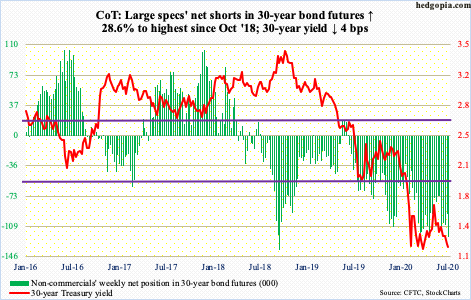
30-year bond: Currently net short 122.3k, up 27.2k.
Major economic releases next week are as follows.
The ISM manufacturing index (July) is due out Monday. Manufacturing activity rebounded in June with a month-over-month increase of 9.5 points to 52.6. April’s 41.5 was an 11-year low.
Durable goods orders (June, revised) come out Tuesday. Preliminarily, orders for non-defense capital goods ex-aircraft – proxy for business capex plans – increased 3.3 percent to a seasonally adjusted annual rate of $64.3 billion. On a year-over-year basis, orders were down 3.2 percent, for a fourth straight y/y decline.
Wednesday brings the ISM non-manufacturing index (July). June services activity jumped 11.7 points m/m to 57.1 – a four-month high.
Nonfarm payrolls (July) are on tap Friday. The economy produced 7.5 million nonfarm jobs in May and June. Before this, 22.2 million jobs were lost between February and April.
WTI crude oil: Currently net long 637.8k, down 18k.
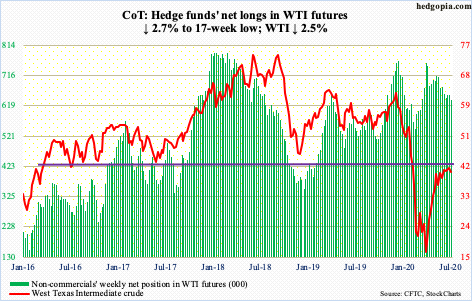
For the first time in two and a half months, oil bulls were forced to defend the 50-day moving average, which they successfully fulfilled on Thursday. But breach risks are rising.
WTI ($40.27/barrel) bottomed at $6.50 on April 21 and essentially went sideways after it filled an early-March gap nearly eight trading weeks ago. For the last several weeks, the crude increasingly traded around its 10- and 20-day, which are converging. Concurrently, the daily Bollinger bands are narrowing, with merely $2.40 separating the two; this usually precedes a sharp move – either up or down. The risk is to the downside – if nothing else just to unwind weekly overbought conditions.
A loss of the 50-day opens the door to a test of $34-35.
In the meantime, US crude production in the week to July 24 was unchanged at 11.1 million barrels per day. Crude imports fell 595,000 b/d to 5.1 mb/d, while crude stocks tumbled 10.6 million barrels to 526 million barrels – a 14-week low. But gasoline and distillate stocks rose – up respectively 654,000 barrels and 503,000 barrels to 247.4 million barrels and 178.4 million barrels. Refinery utilization increased 1.6 percentage points to 79.5 percent.
E-mini S&P 500: Currently net short 39.2k, down 3.8k.
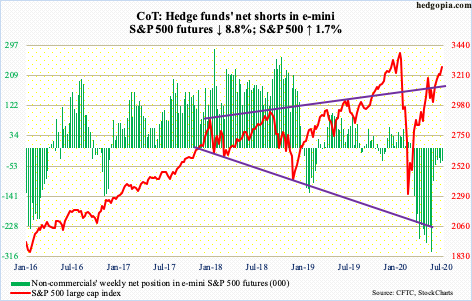
Several times last week, after slightly exceeding gap-down resistance from February 24, the S&P 500 (3271.12) attempted to fill the gap, but bulls were consistently denied at 3270s.
Thursday this week, bears had a decent opportunity to reclaim near-term momentum, but bulls stepped up to defend the 20-day, with the session only closing down 12.22 from down 54.31 at one time. The average approximates near-term support at 3200. Once it gives way, bears will be eyeing 3150s and the 50-day at 3137.52 after that.
As things stand, one possible advantage bears have is that last Friday the index lost a rising trend line from the March low, followed by rallies early this week all along the underside of that broken support. But bulls are not willing to give in just yet. Both Thursday and Friday, they defended the 20-day; Thursday’s was a potential hanging man, while Friday’s was a dragonfly doji, which suggests sell orders are growing, although bulls so far have been able to absorb those.
In terms of flows, US-based equity funds lost $3.8 billion in the week to Wednesday (courtesy of Lipper). In the same week, SPY (SPDR S&P 500 ETF), VOO (Vanguard S&P 500 ETF) and IVV (iShares Core S&P 500 ETF) collectively lost $990 million (courtesy of ETF.com).
Margin debt has provided a tailwind to stocks since bottoming in March, which increased $105.4 billion in April-June to $584.7 billion. Even here, FINRA margin debt for a while now has correlated better with small-caps than large-caps (more on this here).
Euro: Currently net long 157.6k, up 32.5k.
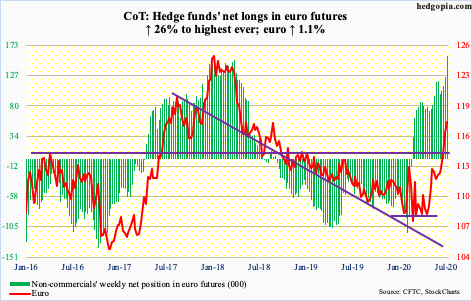
A potentially major development just occurred in the currency land. With the euro making up 57.6 percent of the US dollar index, the currency benefited big time from the greenback’s recent plight.
The euro broke out of a falling trend line from April 2008 when the currency peaked at $160.20. It has absolutely gone parabolic since breaking out of $114.50s nine sessions ago, rallying all along the sharply-rising daily upper Bollinger band.
Bulls’ mettle will be tested at horizontal support at $119-120, which goes back to May 2003. After tagging $118.55 intraday, the euro ($117.79) reversed slightly lower Friday.
In the meantime, non-commercials have never been as bullish as they are now. Net longs in euro futures are the highest ever. A contrarian is likely to treat this with caution.
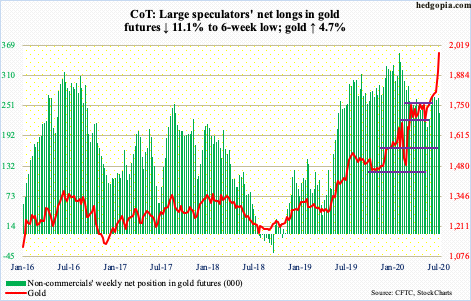
Gold: Currently net long 236.8k, down 29.6k.
Money continued to flow into gold-focused ETFs. In the week to Wednesday, IAU (iShares Gold Trust) took in $963 million and GLD (SPDR Gold ETF) $1 billion (courtesy of ETF.com). IAU has witnessed inflows for 19 weeks straight, for a total haul of $6 billion; GLD had one down week during that period, gaining $17.6 billion.
These investments are sitting pretty. Gold ($1,985.90/ounce) rallied further this week to Friday’s new intraday high of $2,005.40. The prior high of $1923.70 from September 2011 was surpassed on Monday. This is a major breakout, although the parabolic way in which it has rallied the last couple of weeks is unsustainable.
Gold rallied 4.7 percent this week, with some signs of fatigue. Both Tuesday and Wednesday were marked by a spinning top, while Friday too produced a candle with a long upper shadow. The strength of this week’s breakout will be confirmed should a $1,920s retest occur and hold. There is now also solid support at $1,790s.
Ahead of Friday’s new high in the metal, non-commercials cut back net longs in gold futures to a six-week low.
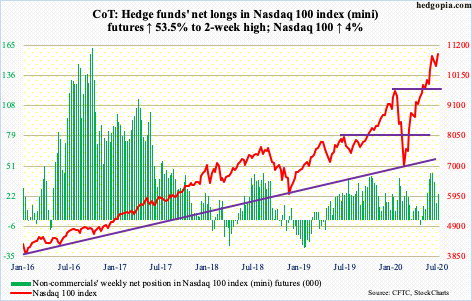
Nasdaq 100 index (mini): Currently net long 24.1k, up 8.4k.
In the week to Wednesday, QQQ (Invesco QQQ Trust) pulled in $93 million; in the prior week, $63 million was withdrawn. These are peanuts relative to recent weekly flows. It feels like investors cannot decide whether to feel bullish or bearish.
This is similar to how the Nasdaq 100 (10905.88) has traded of late. Since peaking at 11069.26 intraday on July 13, it is searching for direction itself. There have been signs of distribution, but at the same time bulls continue to defend the 10- and 20-day. Friday saw a strong defense of these averages; for bears’ consolation, a potentially bearish hanging man was formed in that session. Also, a rising trend line from the March low has been lost. Odds will grow in bears’ favor once the aforementioned averages roll over. In this scenario, nearest support lies at 10300s, and 9800 after that.
Russell 2000 mini-index: Currently net long 15.6k, up 19k.

Small-caps bulls and bears continue a tug of war just above 1450s-60s, which the Russell 2000 broke out of mid-July. Since then, bulls have been made to defend the breakout several times, including Friday. With that said, the index (1480.43) has fallen out of an ascending channel from the March low.
Thus, as long as 1450s-60s is intact, bulls deserve the benefit the doubt. A breach likely hastens a move toward 1330s, particularly so if flows disappoint.
In the week to Wednesday, IWM (iShares Russell 2000 ETF) lost $980 million and IJR (iShares Core S&P Small-Cap ETF) $25 million (courtesy of ETF.com).
US Dollar Index: Currently net short 6.7k, up 934.
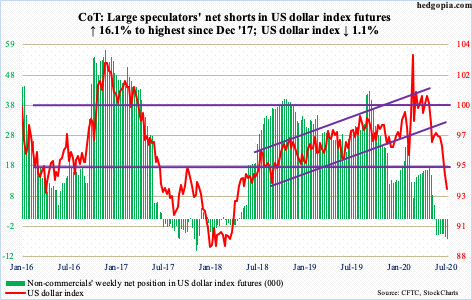
In the last 16 sessions, the US dollar index (93.34) was up only three times, including Friday when it reversed intraday; the session low of 92.52 occurred at horizontal support around 92. This was preceded by a breach early this week of a rising trend line from May 2011 when the index bottomed at 72.70. If things do not stabilize soon around here, and 92 is not saved, the next stop is 88-89.
VIX: Currently net short 88.9k, down 6.3k.
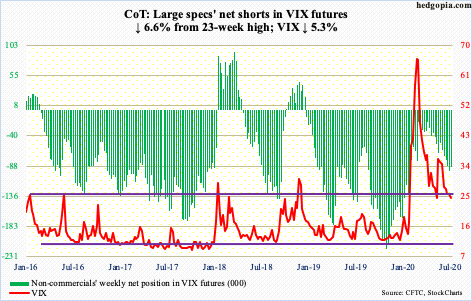
VIX (24.46) is no longer below a falling trend line from March 18 when the volatility index peaked at 85.47. This is not because it broke out, but because of passage of time. Since it is a falling trend line, the point at which a breakout would occur continues to drop. Last Friday, VIX broke out intraday but only to end up right on that trend line by close. In the first three sessions this week, it trended lower clinging on to that trend line. Come Thursday, VIX rallied to 28.29 intraday – past the 200-day at 27.01 and just below the 50-day at 28.89 – but closed at 24.76, for a gravestone doji.
For volatility bulls, the good thing – if it can be called that – is that support at 23.50-24 is holding. The daily Bollinger bands have continued to narrow, but not as narrow as during the days leading up to volatility surge in February and March. Contraction in the bands more often than not leads to a sharp move – either up or down. If what is transpiring elsewhere in the options market is any sign, volatility is getting ready to rally.
The 21-day moving average of the CBOE equity-only put-to-call ratio ended the week at 0.468, with Wednesday’s 0.463 the lowest ever going back to October 2003. Greed is rampant.
Thanks for reading!

