
Following futures positions of non-commercials are as of September 22, 2020.
10-year note: Currently net long 82.2k, up 67.4k.
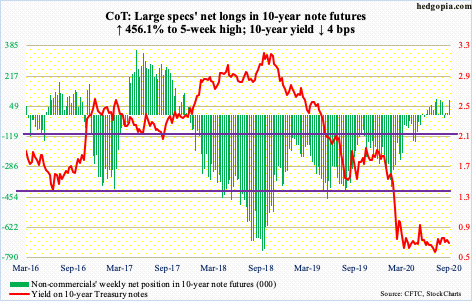
Several Fed officials this week stressed on the need for Congress to get its act together and provide fiscal help. This included Chair Jeremy Powell who spoke at a congressional hearing on Wednesday.
Since March in particular, when the Fed announced open QE and also said it would begin to purchase investment-grade corporate bonds, which in April was expanded to include junk bonds, it has implicitly provided a backstop to stocks.
At the same time, Fed officials’ constant appeal to Congress to act also lays bare the limits of monetary policy. The Fed already holds $7.09 trillion in assets, down slightly from record $7.17 trillion reached in the week to June 10. The fed funds rate is already zero-bound. It already tweaked its inflation language, with Powell stating at this year’s Jackson Hole that it has now adopted an “average inflation target”, under which it will seek to achieve inflation that averages two percent over time.
Increasingly, it feels the Fed’s monetary quiver is running out of arrows – or running thin – hence the repeated attempts to have Congress share the stimulus burden.
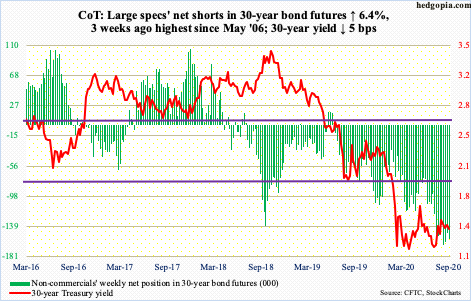
30-year bond: Currently net short 157.1k, up 9.4k.
Major economic releases next week are as follows.
The S&P Case-Shiller home price index (July) is scheduled for Tuesday. Nationally, US home prices appreciated 4.3 percent in the 12 months to June. The trend is in deceleration since April’s 4.6 percent rise.
GDP (2Q20, final estimate) and corporate profits (2Q20, revised) are due out Wednesday.
The second estimate showed real GDP collapsed 31.7 percent in 2Q, coming on the heels of a five-percent drop in 1Q.
The preliminary estimate showed 2Q corporate profits with inventory valuation and capital consumption adjustments tumbled 20.1 percent year-over-year to a seasonally adjusted annual rate of $1.81 trillion. The record high $2.31 trillion was reached in 4Q19.
Personal income/spending (August) and the ISM manufacturing index (September) are on tap for Thursday.
In the 12 months to August, core PCE (personal consumption expenditures), which is the Fed’s favorite measure of consumer inflation, rose 1.3 percent. In April, prices were only rising 0.91 percent.
Manufacturing activity rose 1.8 points month-over-month to 56 in August – a 21-month high.
Friday brings nonfarm payrolls (September), durable goods orders (August, revised) and the University of Michigan’s consumer sentiment index (September, final).
Between February and April, the economy lost 22.2 million non-farm jobs. From the April low through August, 10.6 million jobs were gained back, to 140.9 million.
August’s advance estimate showed orders for non-defense capital goods ex-aircraft – proxy for business capex plans – increased 2.8 percent y/y to $67.7 billion (SAAR), which is a 25-month high.
Preliminarily, September consumer sentiment rose 4.8 points m/m to 78.9 – a six-month high. The index was down to 71.8 in April.
WTI crude oil: Currently net long 555.3k, up 1.4k.
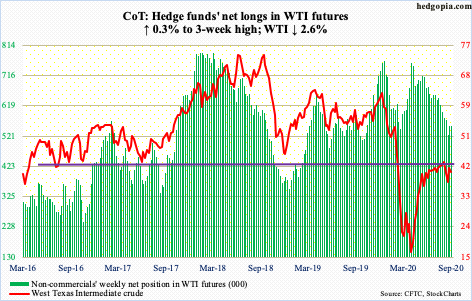
Once again, WTI ($40.25/barrel) is caught in a confluence of moving averages. Merely $1.33 separate the 10- and 50-day; in between lie the 20- and 200-day. During the week, bids showed up at the 10-day ($39.78) and offers at the 50- and 200-day ($40.18). Earlier, toward the end of August, the crude saw selling pressure at $43.50s, even as $36 was defended three weeks ago. It is a wide range, but for now WTI likely plays ping pong between these levels.
In the meantime, the EIA report for the week to September 18 showed US crude production dropped 200,000 barrels per day to 10.7 million b/d; three weeks ago, production was down to 9.7 mb/d, which was the lowest since January 2018. Stocks of crude, gasoline and distillates all fell – respectively down 1.6 million barrels, four million barrels and 3.4 million barrels to 494.4 million barrels, 227.5 million barrels and 175.9 million barrels. Crude imports, however, rose 160,000 b/d to 5.2 mb/d. Refinery utilization fell a percentage point to 74.8 percent.
E-mini S&P 500: Currently net long 59.7k, up 38.2k.
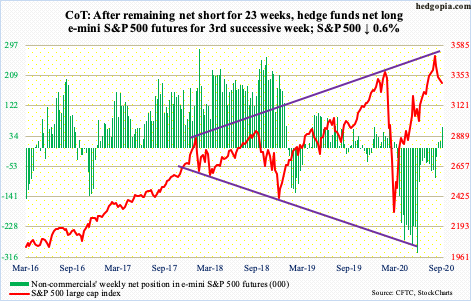
After getting rejected at the upper line of an ascending broadening wedge early this month, the S&P 500 is witnessing sellers get active. From the September 2nd high of 3588.11 through Thursday’s low of 3209.45, the index (3298.46) quickly lost 10.6 percent. This has impacted investor sentiment. Investors Intelligence bulls this week fell to 51.5 percent, down from 61.5 percent in the week to September 1, which was a 100-week high (more on this here). Sentiment has a long way to go on the downside before the elevated optimism is unwound.
Last Friday, the index breached its 50-day (3350.93). This week, bulls charged at the average both Tuesday and Wednesday but only to get repelled; however, they repeatedly defended straight-line support at 3230s. Non-commercials are acting as if this support holds for now; they continue to add to net longs. A loss of this raises the odds of a test of the 200-day at 3107.20, particularly if flows continue to disappoint.
In the week to Wednesday, $14.9 billion came out of US-based equity funds (courtesy of Lipper). In the same week, SPY (SPDR S&P 500 ETF), VOO (Vanguard S&P 500 ETF) and IVV (iShares Core S&P 500 ETF) collectively lost $7.1 billion (courtesy of ETF.com).
Euro: Currently net long 190.8k, up 12.2k.
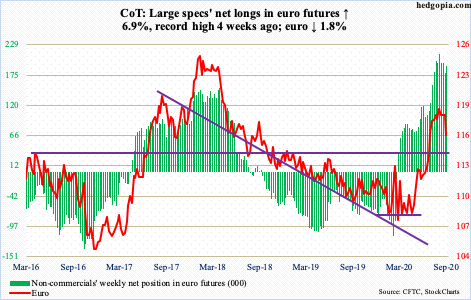
The euro ($1.1632) broke down this week.
Since late July, bears consistently showed up at 17-plus-year resistance at $1.19-1.20, while bulls defended $1.17-$1.175. This preceded a rally from March when on the 20th the euro tagged $1.064 intraday. On the 1st this month, it hit $1.201.
This week, the straight-line support gave way. The 50-day at $1.1778 lies around there as well. The currency remains overbought on both the weekly and monthly. But the daily is oversold, so a relief rally is always possible. Friday produced a doji. Should a rally develop, bears are likely to show up at $1.17-$1.175. Eventually, odds are rising of a test of horizontal support at $1.145.
Gold: Currently net long 219.1k, down 21.9k.

In September 2011, gold ($1,866.30/ounce) retreated after posting $1,923.70. This was an important high and was surpassed two months ago. The metal then proceeded to print a new high of $2,089.20 on August 7. Since then, gold has been caught in a pattern of lower highs, even as bulls consistently showed up to defend $1,920s – until this week.
Monday, gold sliced through that support plus the 50-day at $1,946.79. Earlier, the metal rallied from $1,450.90 on March 16 to last month’s high. Conditions are overbought, including the monthly. In the intermediate term, this week’s breakdown likely opens the door to a test of $1,750-1,800. Immediately ahead, the daily is beginning to look oversold. Should a rally develop, how things evolve around $1,920s is key.
The risk facing gold bugs is what has transpired in gold-focused ETFs ahead of this week’s action. In the week to Wednesday, IAU (iShares Gold Trust) took in $193 million. This was the 27th straight week of inflows, for a cumulative total of $8 billion. In those 27 weeks, GLD (SPDR Gold ETF) had five weeks of outflows for a gain of $19.2 billion, including this week’s $1.2 billion (courtesy of ETF.com). Inability to reclaim the September 2011 high can adversely impact sentiment. Non-commercials have been trimming their net longs.
Nasdaq 100 index (mini): Currently net short 134.3k, up 53.4k.
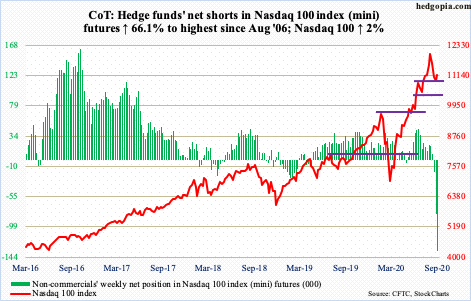
With three sessions to go, September thus far has produced an outside month – potentially a reversal candle. This precedes five positive months in a row – all of them marubozu candles.
From the September 2nd high of 12439.48 through Monday’s low, the Nasdaq 100 (11151.13) dropped 14.2 percent – pittance in the big scheme of things. From the March low, the index surged 84 percent.
Bulls defended the 50-day (11224.69) for several sessions before they could no longer handle the sell orders. The index has been under the average for seven sessions now. Both Tuesday and Wednesday this week, rally attempts were denied at the average, which is now flattish.
Shorts are the wildcard here. As of Tuesday last week, non-commercials had accumulated 80,871 contracts in net shorts, which were the highest since April 2008. This week, they added 53,440 more, to the highest since August 2006. This is coming at a time when Nasdaq short interest is near a 12-year high (chart here). If tech bulls can regroup and reclaim the 50-day, squeeze odds are growing. They hope things evolve similar to what transpired in e-mini S&P 500 futures the past three months (more on this here).
Russell 2000 mini-index: Currently net long 12.1k, down 4.5k.
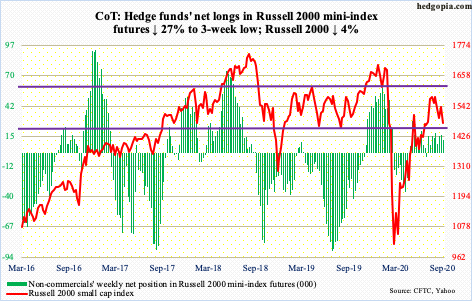
On August 11, the Russell 2000 (1474.91) failed at resistance just north of 1600, with the session high of 1603.60. This resistance goes back to January 2018. Since that rejection, sellers began showing up at 1570s, followed by 1530s, which currently approximate the 50-day (1529.90).
This week, horizontal support at 1450s-60s was tested. The 200-day at 1457.95 lies there as well. Thursday’s intraday breach of this dual support came in a long-legged doji session. The daily is oversold, so this is an opportunity for small-cap bulls to put their foot down. Should a rally ensue, the 50-day is where sellers might show up. In due course, bears probably have their sights set on 1340s-50s.
US Dollar Index: Currently net short 9.1k, up 906.
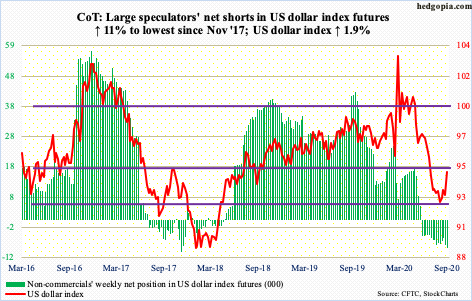
The US dollar index (94.68) broke out of a two-month range. Since late July, it has played ping pong between 92 and 94, give and take. This preceded a five-plus-month drop from 103.96 on March 23 to 91.75 on the 1st this month.
Support at 92 goes back to at least June 2003 and it held. Near-term notwithstanding, this week’s range breakout in due course can extend to 96.
VIX: Currently net short 90.9k, down 1.3k.
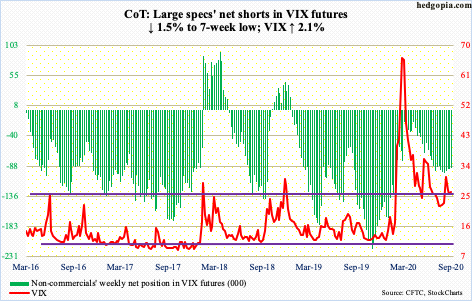
VIX (26.38) continued its back-and-forth action between the 50- and 200-day. Wednesday’s intraday low of 25.19 found support at the 50-day (25.14), while the 200-day (29.33) posed an obstacle throughout the week.
From volatility bulls’ perspective, the 50-day is no longer dropping, rather flattish, even as the 200-day is slightly rising. Monday’s intraday high was 31.18. A higher high opens the door to testing horizontal resistance at 36-37. On the 4th this month, VIX retreated sharply after hitting 38.28 intraday.
Thanks for reading!
