
Following futures positions of non-commercials are as of October 20, 2020.
10-year note: Currently net long 23k, down 52.3k.
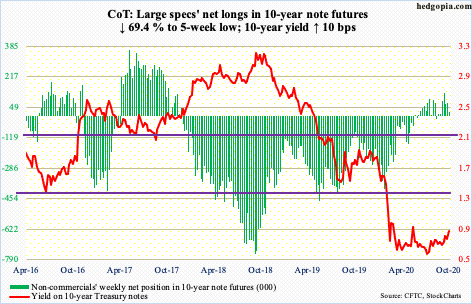
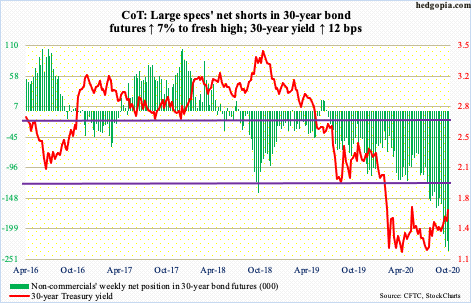
Treasury yields are rallying. The 10-year (0.84 percent) Friday unsuccessfully tested its 200-day moving average, even as the 30-year (1.65 percent) achieved that feat on the 7th as well as Monday this week. For the week, they were up 10 basis points and 12 basis points, respectively.
This is coming at a time when the Fed continues to gobble up Treasury notes and bonds, with additional purchases of $20.5 billion in the week to Wednesday, to $3.83 trillion. Early March, the central bank held $2.03 trillion in these securities.
More important perhaps is the fact that the spread between the two continues to widen, with this week’s 80 basis points a bit more than last week’s 79 basis points. At the start of the year, the 30-year yielded 47 basis points more than the 10-year.
Non-commercials positioned for a steeper yield curve could not be happier. As things stand, they are net short 30-year bond futures and net long 10-year note futures. The long end of the curve is probably pricing in a Joe Biden victory in the upcoming election and, by default, higher deficit. Remains to be seen how this trade shakes out post-November 3rd. Ahead of this, bears (on price) were unable Friday to hang on to the intraday gains in yields. On the daily, both 10- and 30-year yields are itching to go lower.
30-year bond: Currently net short 236.6k, up 15.5k.
Major economic releases next week are as follows.
New home sales (September) are due out Monday. In August, sales rose 4.8 percent month-over-month to a seasonally adjusted annual rate of 1.01 million units. In April, they were down to 570,000 units.
Durable goods orders (September) and the S&P Case-Shiller Home Price Index (August) are scheduled for Tuesday.
Orders for non-defense capital goods ex-aircraft – proxy for business capex plans – increased 1.8 percent m/m to $67.7 billion (SAAR) – a two-year high. Orders dropped to $61.3 billion in April.
Nationally, US home prices increased 4.8 percent year-over-year in July. This was the fastest growth rate since November 2018.
Thursday brings GDP (3Q20, first print). Real GDP contracted at an annualized rate of 31.4 percent in 2Q. This followed a five-percent drop in 1Q. As of October 20th, the Atlanta Fed’s GDPNow model forecasts 35.3-percent growth in 3Q.
Personal income/spending (September), the employment cost index (3Q20) and the University of Michigan’s consumer sentiment index (October, final) will be published Friday.
In the 12 months to August, core PCE (personal consumption expenditures) – the Fed’s favorite measure of consumer inflation – rose 1.59 percent. Since April’s 0.93 percent, inflation has risen every month. That said, the last time inflation was over two percent was in December 2018.
In 2Q, private-industry total comp increased 2.7 percent y/y.
Preliminarily, consumer sentiment this month increased 0.8 points m/m to 81.2. Sentiment dropped to 71.8 in April and was 101 in February.
WTI crude oil: Currently net long 556.2k, up 28.1k.
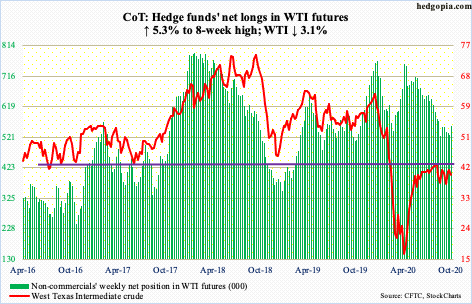
Tuesday, WTI ($39.85/barrel) rallied to $41.90 intraday and sellers quickly came out of the woodwork. For nearly four months now, rally attempts have been bound by $41-$42. The entire week, the crude went back and forth around the 50-day ($40.62).
In essence, WTI remains rangebound between $41-$42 and $36. The last time this support was defended was early this month. For a test to occur again, bears first need to take out the 200-day ($38.10), which continues to point down. A test of the average looks imminent. There is room for the daily to head lower.
In the meantime, the EIA report for the week to October 16 showed US crude production dropped 600,000 barrels per day to 9.9 million b/d. As did crude imports, which fell 168,000 b/d to 5.1 mb/d. Stocks of crude and distillates fell as well – down one million barrels and 3.8 million barrels respectively to 488.1 million barrels and 160.7 million barrels. Refinery utilization declined 2.2 percentage points to 72.9 percent. Gasoline stocks rose 1.9 million barrels to 227 million barrels.
E-mini S&P 500: Currently net long 57.8k, up 17.6k.
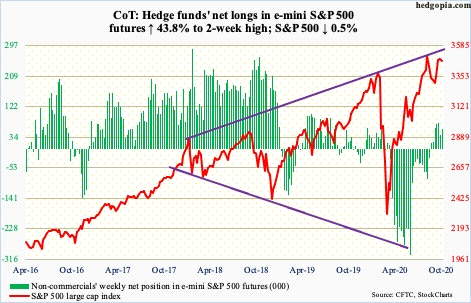
As soon as the week began, the S&P 500 sliced through its 10-day, which is now flattish. Then, on both Tuesday and Wednesday, rally attempts were sold at that average. Before bears could build on this, bulls showed up Thursday between horizontal support at 3420s and the 50-day (3407.86). Intraday weakness was again bought on Friday.
At 3420s, the large cap index 12 sessions ago broke out of the neckline of an inverse head-and-shoulders, subsequent to which it rallied to 3549.85 two weeks ago – for a lower high. The index (3465.39) peaked at 3588.11 on September 2nd. A trend line from that high draws to 3520s. Bulls for now would love to at least test that level. For that, they need to continue to defend the 50-day, which, too, is now flattish.
Flows were mixed. In the week to Wednesday, SPY (SPDR S&P 500 ETF), VOO (Vanguard S&P 500 ETF) and IVV (iShares Core S&P 500 ETF) collectively gained $5 billion (courtesy of ETF.com), while US-based equity funds lost $5.7 billion (courtesy of Lipper).
Euro: Currently net long 165.9k, down 2.7k.
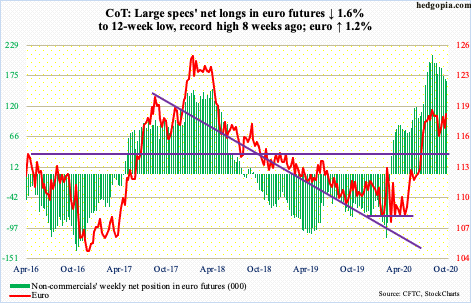
It seems the 50-day ($1.1799) increasingly is being treated by bulls and bears as a line in the sand. For over a month now, the euro ($1.1861) has traded on either side of the average. This week, it was recaptured Tuesday, but only to retreat after posting $1.1882 intraday Wednesday.
Resistance at $1.19-$1.20 goes back to May 2003. The currency has been denied at this level for three months now, although it did rally to $1.2011 on September 1st. Earlier on March 20th the euro bottomed at $1.0635.
There is support at $1.17-$1.175, which now lines up with trend-line support from September 25th when the currency dropped to $1.1612. It likely gets tested in the sessions ahead.
Longer-term, the euro remains overbought on the monthly.
Gold: Currently net long 249.6k, up 8.9k.
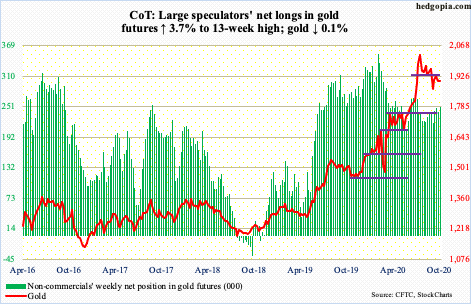
The tug-of-war continues. In late July, gold ($1,905.20/ounce) broke past the September 2011 record high of $1,923.70. By August 7th, the metal posted a new high of $2,089.20, before coming under pressure. Then began the bull-bear duel for control of $1,920s, which bulls lost on September 21st. Since then, bears have consistently shown up in defense of that breach, including this week when the yellow metal tagged $1,936 intraday but was unable to hang on to it. The 50-day lies at $1,930.66.
Near-term, there is support at $1,850s. Earlier on March 16th, gold bottomed at $1,450.90. The billions that moved into IAU (iShares Gold Trust) and GLD (SPDR Gold ETF) the past seven months are the wildcard. In the week to Wednesday, IAU took in $126 million; in the last 31 weeks, there was one week of outflows, for a cumulative haul of $8.3 billion. During those 31 weeks, GLD (SPDR Gold ETF) had six weeks of outflows, including this week’s $499 million, for total gains of $19.4 billion (courtesy of ETF.com). Continued inability to recapture $1,920s after repeated attempts can tempt these longs to lock in gains.
Nasdaq 100 index (mini): Currently net long 6.1k, down 11.8k.
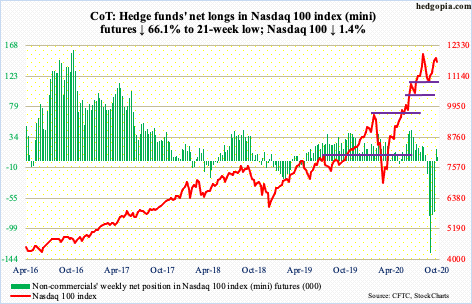
The Nasdaq 100 (11692.57) posted a new all-time high of 12439.48 on September 2nd. Two weeks ago, on October 12th, it put in a lower high of 12204.75. Monday this week, it knifed through the 10-day. In the next two sessions, the average stopped rally attempts.
From bulls’ perspective, the good thing is that the 50-day (11523.26) was just about tested both Thursday and Friday – successfully. The average approximates horizontal support at 11500-11600. This is a must-hold.
Bulls probably were not too happy with how within three weeks non-commercials unwound massive net shorts in Nasdaq 100 index (mini) futures without much of a lift to the cash (more on this here). But bygones be bygones. They now have to deal with what is at hand, which is to save the 50-day.
Russell 2000 mini-index: Currently net long 40.8k, up 11.5k.
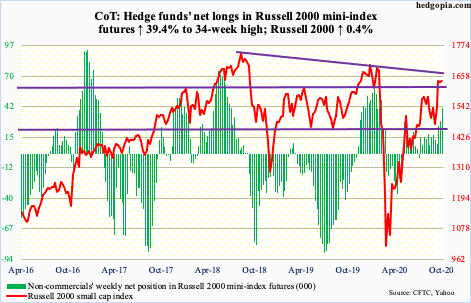
No sooner than small-cap bulls staged a major breakout than they are having to fend off bears determined not to give in that easy. Two weeks ago, the Russell 2000 (1640.50) broke out of 1600-plus. Since January 2018, bulls and bears have repeatedly fought over control of this level. Bulls last lost this in late February this year.
Shortly after the breakout, on the 12th the small cap index tagged 1652.04. Since then, rally attempts have stopped at lower highs. This is a small victory for bears, but unless they are able to decisively push the price back below the said level this remains bulls’ ball to lose.
On the daily, it is possible a flag is forming, which is potentially bullish.
US Dollar Index: Currently net short 1.7k, up 2.1k.
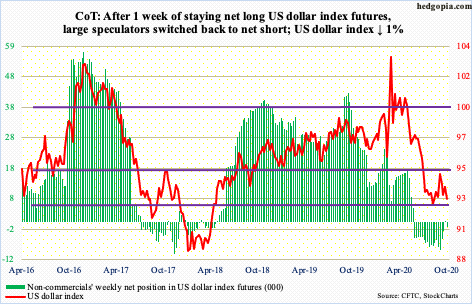
Intraday last Thursday, the US dollar index (92.76) tagged 93.93. The area has provided resistance for three months now. By Wednesday this week, it was down to 92.46. Support at 92 goes back to at least June 2003.
In sum, a three-month rectangle between 94 and 92 is intact. For now, the daily is itching to rally. The 50-day is at 93.29.
VIX: Currently net short 107.3k, up 5.4k.
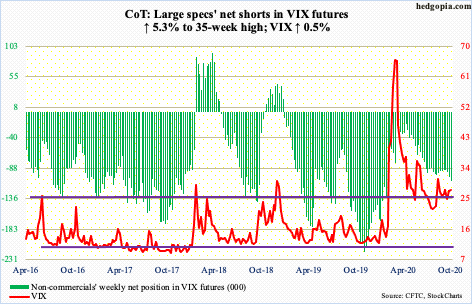
Once again, VIX (27.55) was denied at the 200-day (30.73), which maintains its gradual upward slope. Wednesday’s high of 30.65 kissed the average intraday but only to reverse sharply lower to close at 28.65.
In ideal circumstances for volatility bears – and by default equity bulls – the daily can head lower. Should things evolve this way, the 50-day lies at 26.40, followed by crucial support at mid-20s.
Thanks for reading!
