
Following futures positions of non-commercials are as of November 10, 2020 (data published this Monday instead of last Friday due to Veterans Day holiday).
10-year note: Currently net long 94.6k, up 100.3k.
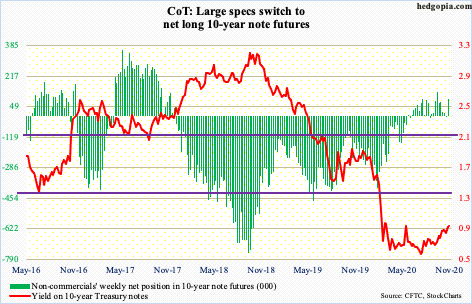
The last time the 10-year Treasury yield (0.91 percent) crossed one percent was on March 20 this year. On June 5, it came close, as rates rallied to 0.96 percent. Bond bears (on price) charged at that ceiling once again on Monday last week but to no avail; the 10-year retreated after hitting 0.98 percent.
Through last week’s high, rates almost doubled in three months, having tagged 0.5 percent in early August. On the daily, there is room for rates to continue lower. But bond bears should like the fact that the 50-day moving average (0.76 percent) is moving up and is on the verge of crossing the 200-day (0.79 percent). The pattern does not always work, but the so-called golden cross, once complete, indicates the potential for a rally.
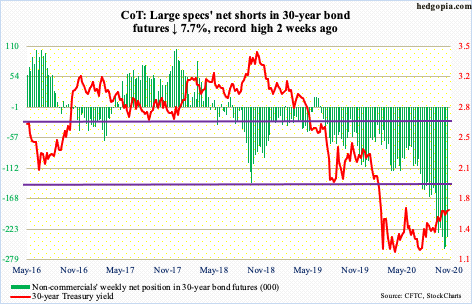
30-year bond: Currently net short 236.6k, down 19.7k.
Major economic releases for the rest of the week are as follows.
Later today, retail sales (October), industrial production (October), the NAHB Housing Market Index (November) and Treasury International Capital data (September) are scheduled.
In the 12 months to September, retail sales increased 5.4 percent to a seasonally adjusted annual rate of $549.3 billion – a new record. In April, sales were languishing at $412.8 billion.
Capacity utilization was down 7.6 percent year-over-year in September to 71.5 percent. In April, utilization was merely 64.2 percent.
Homebuilder confidence increased two points m/m in October to 85 – a new record. Earlier in April, it was down to 30.
In the 12 months to August, foreigners purchased $205.1 billion in US stocks. This was the highest 12-month total since July 2007.
Housing starts (October) are due out Wednesday. In September, starts rose 1.9 percent m/m to 1.42 million units (SAAR). Starts were down to 934,000 units in April.
Thursday brings existing home sales (October). September sales rose 9.4 percent m/m to 6.54 million units (SAAR). This was the fourth straight monthly increase after dropping to 3.91 million in May.
WTI crude oil: Currently net long 509.6k, up 12.4k.
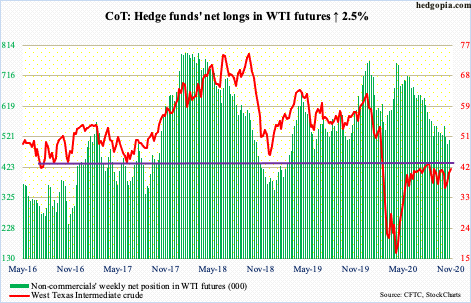
Six sessions ago, WTI ($41.34/barrel) closed right on the 200-day. Last Monday’s positive Covid-19 vaccine news from Pfizer raised investor hopes that the economy would begin to get back to normal next year. The crude shot up 8.5 percent in that session to reclaim the 50-day, followed by another 2.7-percent rally on Tuesday. Intraday Wednesday, it was up another 4.1 percent to 43.06 but bulls were unable to hang on to the gains, edging up 0.2 percent.
Last Wednesday, a shooting star formed right at resistance. Sellers have persistently showed up at $42-$43 for four months now. The 50-day lies at $39.48 and likely gets tested in the sessions ahead.
E-mini S&P 500: Currently net long 37.8k, down 41k.
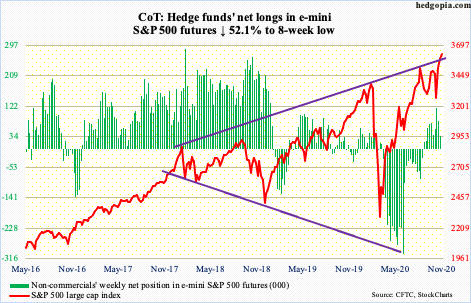
Last week opened with a lot of excitement on Pfizer data. On Monday, the S&P 500 gapped higher, up 3.9 percent to a new intraday high of 3645.99, past the September 2nd high of 3588.11, but when it was all said and done the large cap index only managed to rise 1.2 percent, as sellers showed up willing to sell the rally. The session produced a shooting star – probably not what the bulls would have wanted to see. Plus, a long-legged doji formed on the weekly.
That said, perhaps on the back of the election and Pfizer news, fund flows were very bullish last week. In the week to Wednesday, $23.8 billion moved into US-based equity funds (courtesy of Lipper). In the same week, SPY (SPDR S&P 500 ETF), VOO (Vanguard S&P 500 ETF) and IVV (iShares Core S&P 500 ETF) collectively gained $15 billion (courtesy of ETF.com).
Longer-term, Monday’s (last week) high kissed the upper line of an ascending broadening wedge in place since January 2018. This Monday, Moderna (MRNA), too, delivered positive vaccine data; the S&P 500 rallied 1.2 percent – past 3580s resistance – pushing the daily further into overbought territory. A breather is due.
Euro: Currently net long 135.3k, down 5.1k.
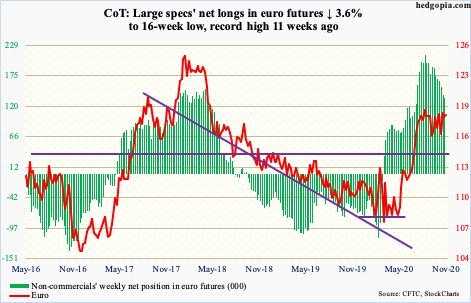
Resistance at $1.19-$1.20 once again came in the way. This ceiling goes back to May 2003. Intraday rally to $1.1921 on Monday last week was aggressively sold.
From euro bulls’ perspective, the good thing is that they were able to hold $1.17-$1.175 as the euro ($1.1854) dropped to $1.1745 last Wednesday, before drawing bids. The 50-day ($1.1772) lies around there as well. A breach raises the odds short-term support just north of $1.16 gets tested again.
Gold: Currently net long 239.7k, down 3.2k.
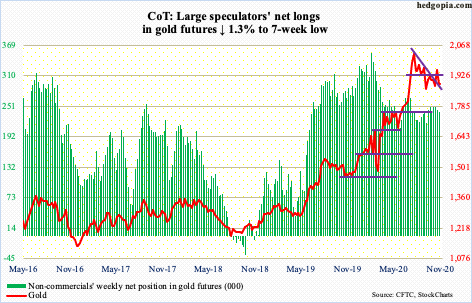
On Monday last week, gold ($1,887.80/ounce) collapsed five percent, landing right at support at $1,850s, negating prior week’s action when the metal not only reclaimed the 50-day but also ended a pattern of lower highs intact since it peaked at $2,089.20 on August 7.
Once again, the yellow metal is under the 50-day ($1,909.86). Gold bugs have so far defended $1,850s and cannot risk losing it. They already failed to latch on to $1,920s.
Nasdaq 100 index (mini): Currently net short 15.3k, up 15.6k.
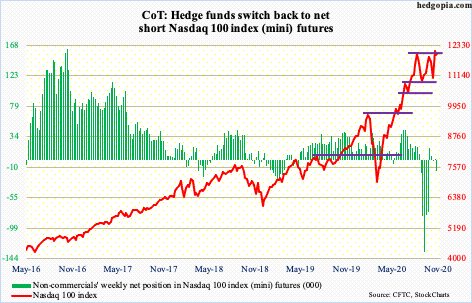
The Nasdaq 100 peaked at 12439.48 on September 2. A lower high of 12204.75 was posted on October 12. This pattern of lower highs was broken on Monday last week when the index rallied to 12268.86 intraday but only to reverse and end the session down 2.2 percent, producing a bearish engulfing candle. In the next session, the 50-day was tested and defended. But last Monday’s reversal post-Pfizer news raises the odds that a change in sentiment is occurring. Once again, the Nasdaq 100 reacted to Monday’s (this week) Moderna news by underperforming its US peers.
Ahead of this, the index (12013.38) was a clear outperformer. It is up 37.6 percent this year, with the likes of Apple (AAPL), Microsoft (MSFT), Amazon (AMZN), Alphabet (GOOG) and Facebook (FB) accounting for most of the gains. In a scenario in which the US economy begins to open up, investors may begin to branch out into small- and mid-caps. That is the risk, and we are beginning to see some signs of it. The ratio of the Nasdaq 100 to the Russell 2000 has retreated since peaking in September (more on this here).
Russell 2000 mini-index: Currently net long 38.5k, up 237.
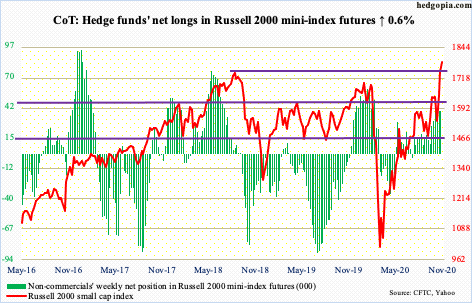
Investor preference for small-caps became evident when post-Pfizer news the Russell 2000 (1785.34) shot up 3.4 percent on Monday last week. This Monday, the day the MRNA news came out, it rallied 2.4 percent.
Monday’s (last week) high of 1745.69 just edged past the old record of 1742.09 from August 2018. The small-cap index continued to face resistance at 1740s the rest of the week. This Monday, it broke out. Ideally, if indeed there is a growth-to-value shift in progress (more on this here), bids should be ready at this level when a retest occurs.
US Dollar Index: Currently net short 1.1k, up 1.9k.
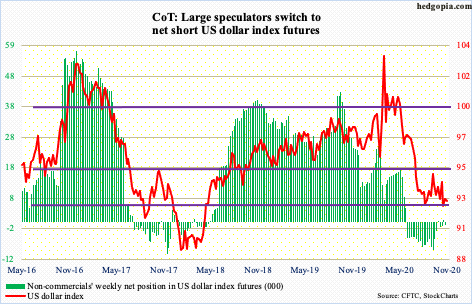
Once again, support at 92, which goes back to at least June 2003, drew bids.
On Monday last week, the US dollar index (92.63) tagged 92.12 intraday to also test the daily lower Bollinger band. By Wednesday and Thursday, the 50-day (93.40) was just about tested.
For over three months now, the dollar index has played ping pong between 94 and 92. Either way it breaks, momentum likely follows – at least in the near term. As things stand, post-defense last week of the lower end of the range, it is dollar bulls’ ball to lose.
VIX: Currently net short 89.5k, up 4.1k.
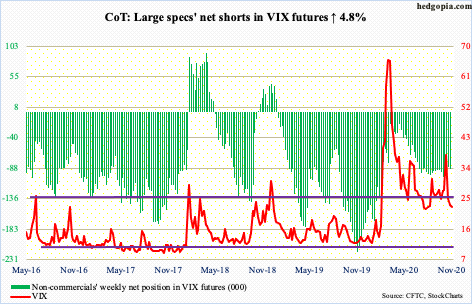
Six sessions ago, which was a Friday, VIX closed at 24.86. Amidst Monday’s (last week) massive rally in equities early on, volatility nose-dived, with VIX making an intraday low of 22.41, which was the lowest since late August; but as the session progressed, equity bulls were unable to hang on to the gains, and demand for protection rose. In the end, VIX closed at 25.75 in that session.
The fact is that the S&P 500 posted a new high on Monday (last week) but VIX did not even test support at low-20s, let alone lower. Volatility bulls should find this encouraging. At least going by the way VIX is behaving, new highs in equity indices is yet to signal full-fledged risk-on.
Thanks for reading!
