
Following futures positions of non-commercials are as of November 17, 2020.
10-year note: Currently net long 152.3k, up 57.7k.
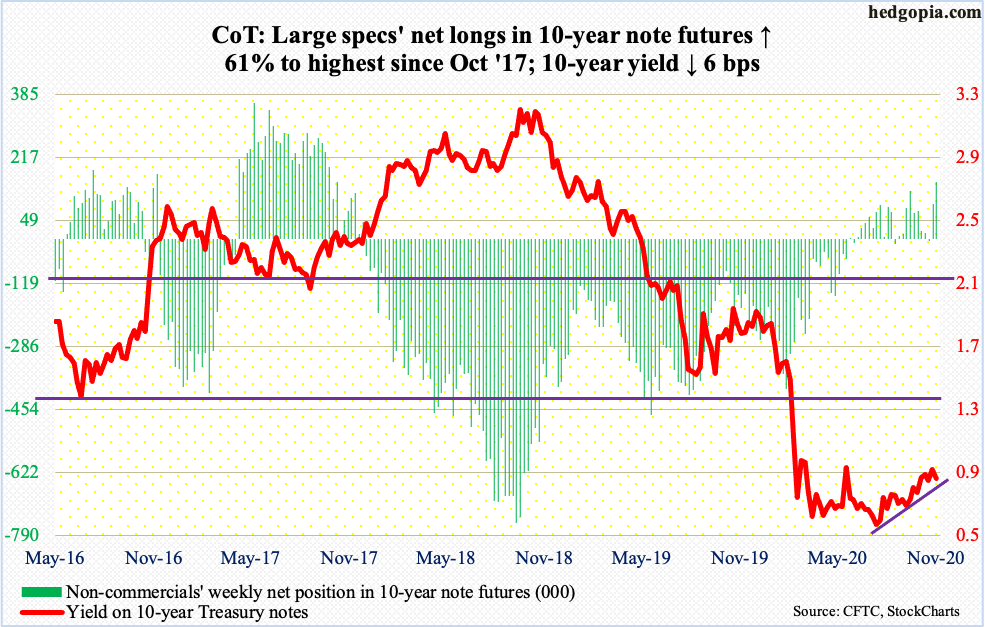
Both the 50- and 200-day moving averages closed Thursday at 0.77 percent. The former is rising and the latter dropping. Friday, the 50-day crossed over. It does not always work, but typically a golden cross can lead to more strength. A lot of times, it can become a self-fulfilling prophecy as traders latch on to the idea.
For this to occur, the 10-year Treasury yield (0.83 percent) first needs to break one percent. The last time these notes yielded one percent was on March 20 this year. Since then, bond bears (on price) came close to achieving that feat a few times, including 0.96 percent on June 5 and 0.98 percent on the 9th this month.
Since that high nine sessions ago, rates have come under pressure. A gap from that date has been filled. This is an opportunity for bears to get active. In the event the 10-year continues lower, the 50- and 200-day can act as a natural magnet, and 0.75 percent after that in a worse-case scenario.
As things stand, non-commercials are positioning for lower rates, with net longs in 10-year note futures the highest since October 2017.
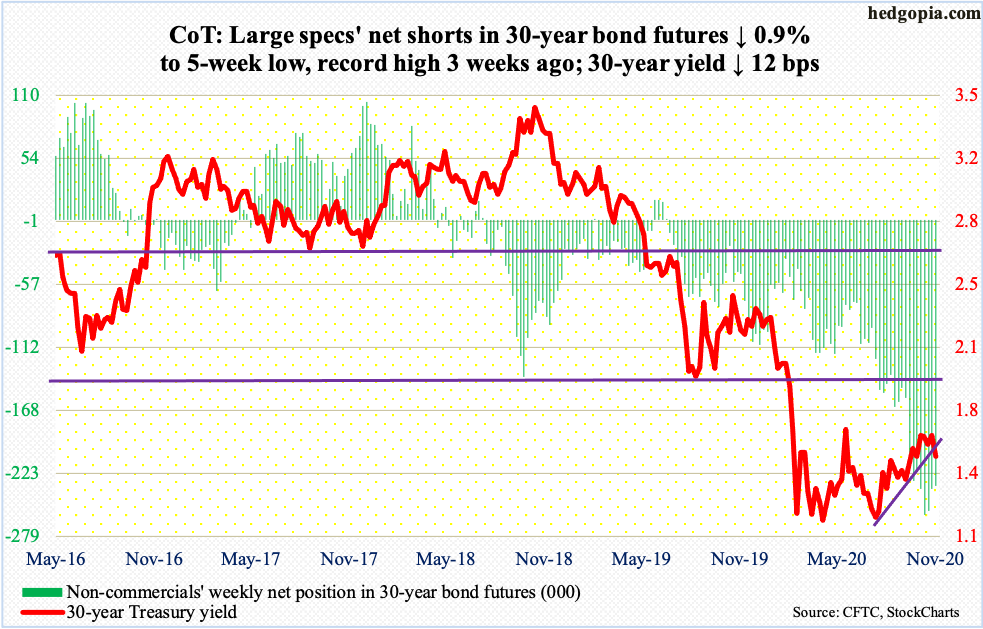
30-year bond: Currently net short 234.4k, down 2.2k.
Major economic releases next week are as follows. Happy Thanksgiving!
The S&P Case-Shiller Home Price Index (September) is scheduled for Tuesday. Nationally in August, US home prices increased at an annual rate of 5.7 percent. This was the fastest monthly pace since July 2018. In August last year, price appreciation slowed to 3.1 percent.
Wednesday brings GDP (3Q20, 2nd print), durable goods orders (October), new home sales (October), personal income/spending (October) and the University of Michigan’s consumer sentiment index (November, final).
The advance print showed 3Q real GDP snapped back with a vengeance – up 33.1 percent. The economy contracted 31.4 percent in 2Q, which was preceded by a five-percent drop in 1Q.
In the 12 months to September, orders for non-defense capital goods ex-aircraft – proxy for business capex plans – increased 4.7 percent to a seasonally adjusted annual rate of six-year-high $68.9 billion.
New home sales in September fell 3.5 percent from August’s 994,000 units (SAAR), which was the highest since December 2006.
In September, core PCE – the Fed’s favorite measure of consumer inflation – rose 1.6 percent y/y. The metric has not registered two-percent growth since December 2018.
Preliminarily, consumer sentiment dropped 4.8 points m/m to 77 this month. The index hit 101 in February and 71.8 in April.
WTI crude oil: Currently net long 533.4k, up 23.8k.
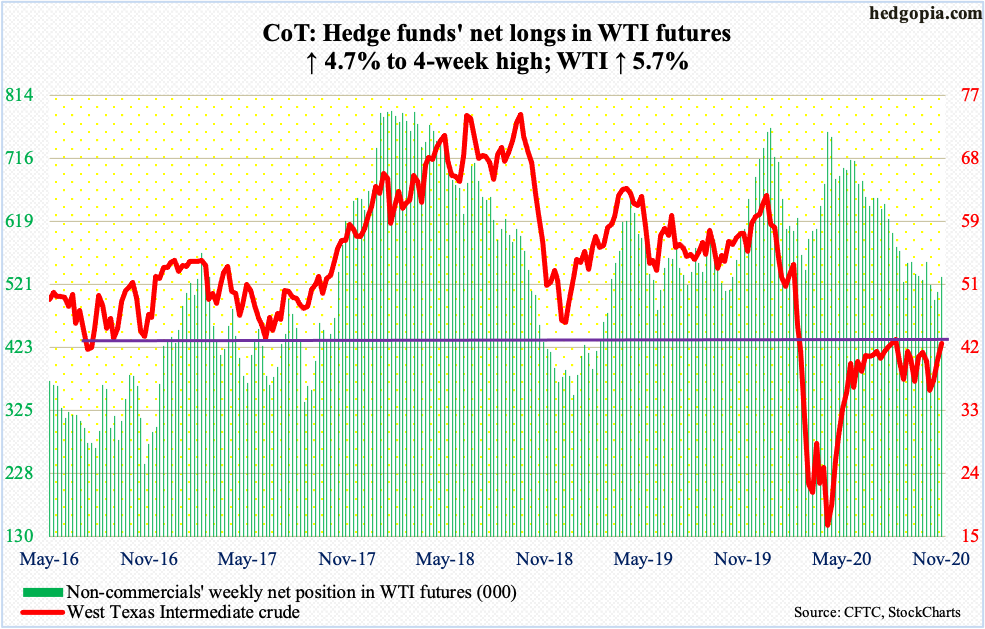
Oil bulls keep hammering on horizontal resistance at $42-$43, which have attracted sellers for nearly five months now. WTI ($42.42/barrel) tagged $42.68 intraday Wednesday before pulling back a tad. From bulls’ perspective, the good thing is that the crude is now above the 50-day, which is now rising. They hope the average ($39.84) provides support the next time WTI comes under pressure. The daily is extended.
In the meantime, the EIA data for the week to November 13 showed US crude production increased 400,000 barrels per day to 10.9 million b/d. Stocks of crude and gasoline rose as well – up 769,000 barrels and 2.6 million barrels to 489.5 million barrels and 228 million barrels respectively. Distillate stocks, however, dropped 5.2 million barrels to 144.1 million barrels. Refinery utilization increased 2.9 percentage points to 77.4 percent. Crude imports declined 245,000 b/d to 5.3 mb/d.
E-mini S&P 500: Currently net long 38.8k, up 1.1k.
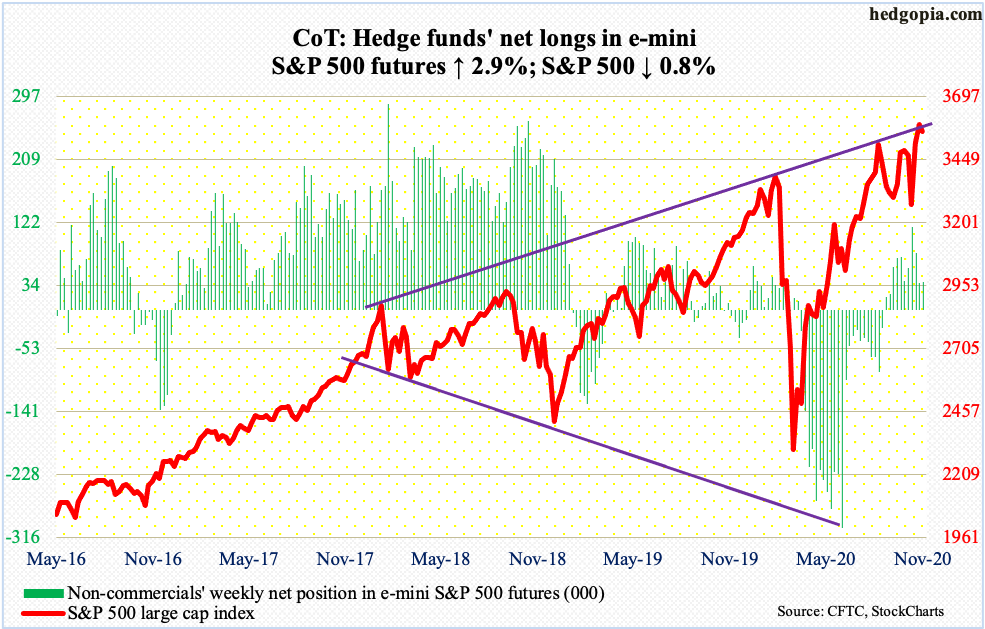
Last week, equity bulls rallied the S&P 500 2.2 percent on Pfizer’s (PFE) positive vaccine news. This week, Moderna (MRNA) announced a similar news. The large cap index rallied but only to give it right back. In the end, the S&P 500 (3557.54) ended the week down 0.8 percent. Fatigue is setting in. This is also evident in flows.
After gaining $23.8 billion in the prior week, $4.9 billion moved into US-based equity funds in the week to Wednesday (courtesy of Lipper). In the same week, SPY (SPDR S&P 500 ETF), VOO (Vanguard S&P 500 ETF) and IVV (iShares Core S&P 500 ETF) lost a combined $818 million. This came on the heels of inflows of $15 billion in the prior week (courtesy of ETF.com).
Elsewhere, post-Pfizer news, various investor-sentiment surveys popped. Post-Moderna news, some did, some did not (more on this here). Even last week, the weekly ended with a long-legged doji. Earlier on Monday last week when the Pfizer news came out, the index rallied to a new intraday high of 3645.99 but only to end with a shooting star.
The point is, bulls are struggling to keep the momentum going even on positive vaccine news. The daily is overbought. The 10-day, which was breached slightly on Friday, is flattening out. The next decent support is not until 3420s, which is where the 50-day (3427.28) lies.
Euro: Currently net long 134k, down 1.3k.
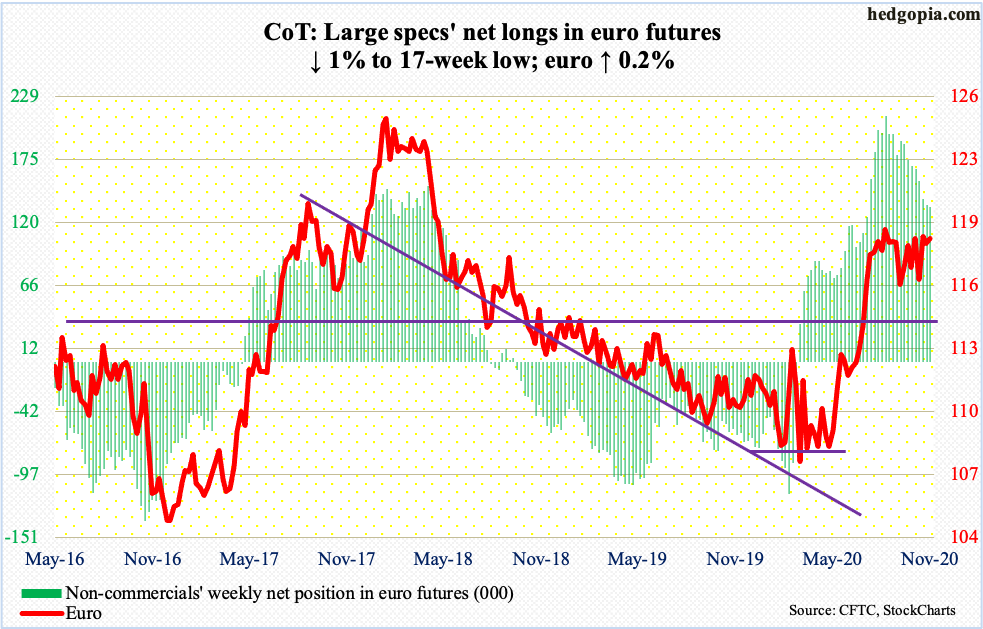
Resistance at $1.19-$1.20 is intact. This ceiling goes back to May 2003. On Monday last week, the euro ($1.1860) rose to $1.1921 intraday and that rally was aggressively sold. The currency remains above the 50-day ($1.1777), which approximates horizontal support at $1.17-$1.175. A test looks imminent.
Gold: Currently net long 251.3k, up 11.5k.
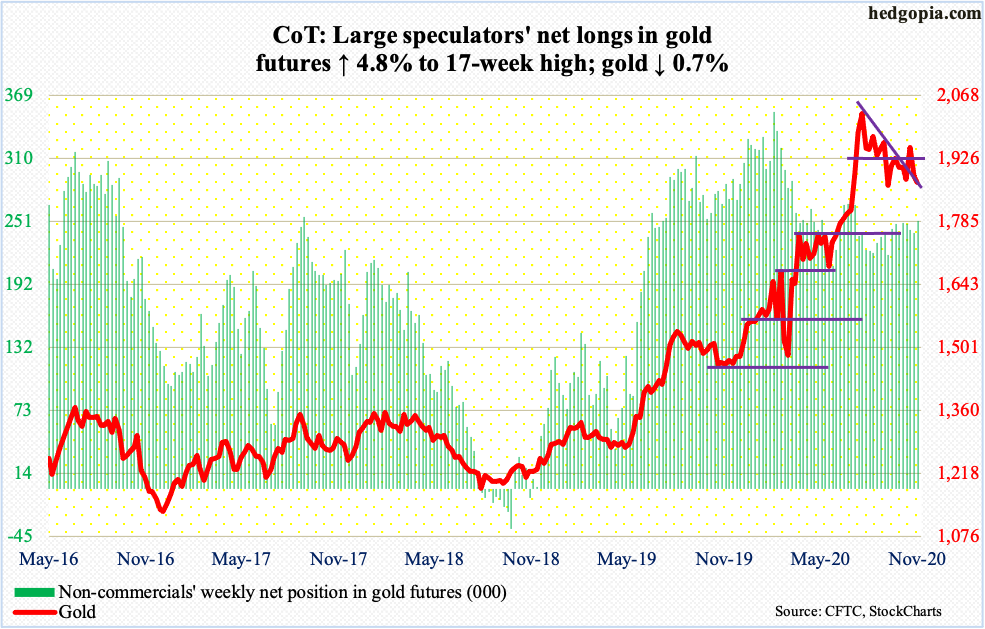
Once again on Thursday, gold bugs were forced to defend $1,850s. On the 9th this month, gold ($1,872.40/ounce) strongly reversed lower, slicing through its 50-day and closing down five percent to $1,850s. Since then, the metal has been unable to sustainably rally. A breach opens the door to a test of the 200-day at $1,797.66.
Gold-focused ETFs are beginning to bleed. In the week to Wednesday, $135 million was redeemed from IAU (iShares Gold Trust) and $1.3 billion from GLD (SPDR Gold ETF). After gold bottomed at $1,450.90 in March, these ETFs attracted tons of money. In the past 35 weeks, IAU has experienced two negative weeks, for cumulative inflows of $8.5 billion. During the period, GLD has witnessed 10 weeks of outflows and is still up $16.3 billion. Longs are beginning to cash in, with GLD in particular losing $3.5 billion in the past five weeks (courtesy of ETF.com).
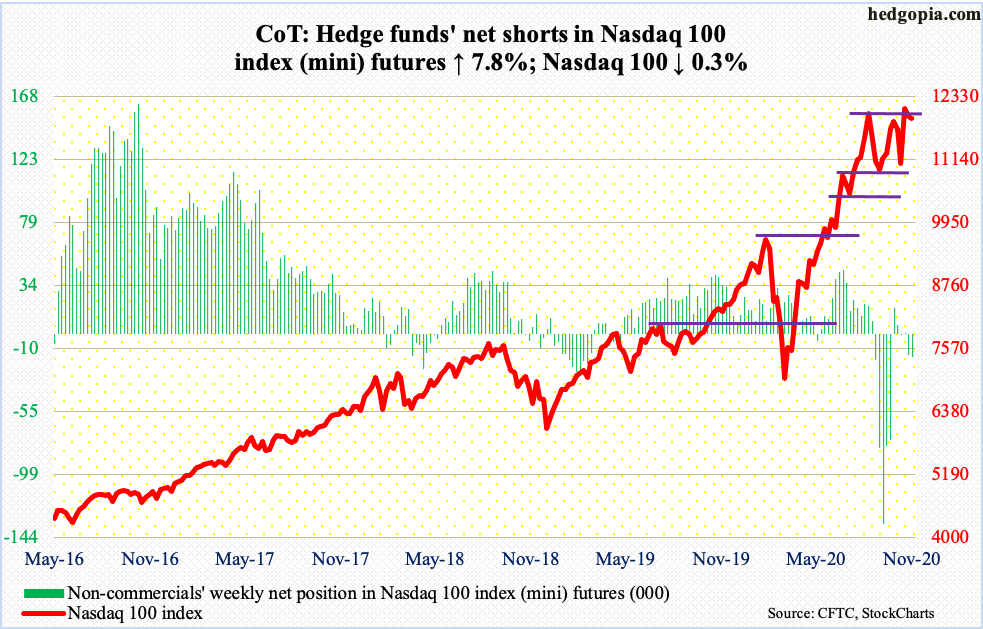
Nasdaq 100 index (mini): Currently net short 16.5k, up 1.2k.
In the week to Wednesday (post-Moderna), QQQ (Invesco QQQ Trust) took in $363 million, preceded by $797 million in the prior week (post-Pfizer). These are lackluster inflows compared to $5.9 billion in outflows in the prior three weeks. This pretty much sums up how investors are beginning to view tech post-news on vaccine development.
On the day the Pfizer news was announced, which was 10 sessions ago, the Nasdaq 100 (11906.44) reversed lower to end the bearish engulfing session down 2.2 percent. In the next session, the 50-day (11552.92) was defended, but bulls have struggled to genuinely build on it. They have been unable to break through 12000. In due course, a test of the average looks imminent, a breach of which opens the door to 11000, which is also where a rising trend line from September 21 extends to.
Russell 2000 mini-index: Currently net long 41.9k, up 3.3k.
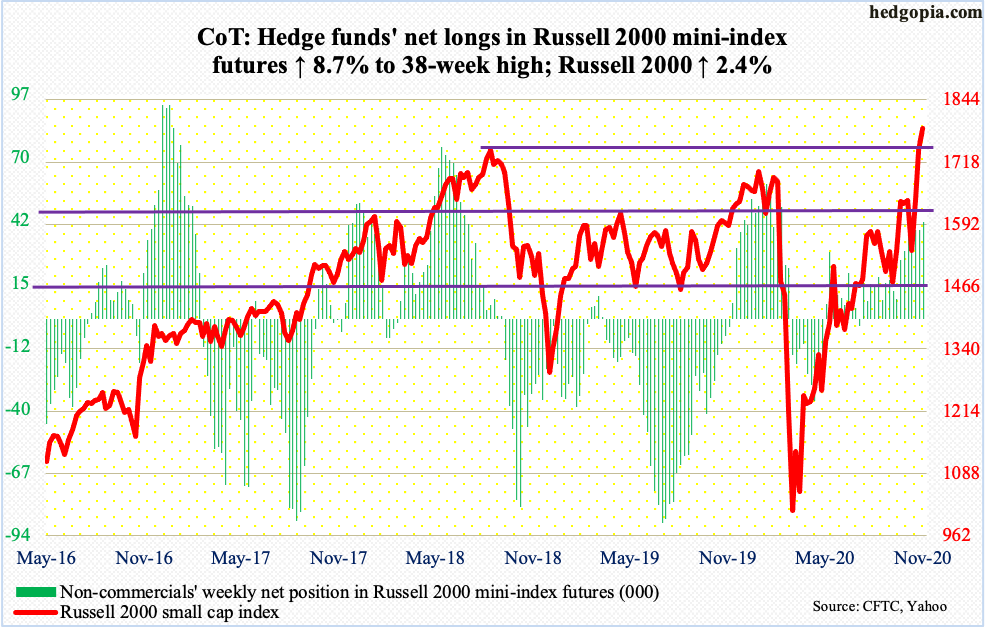
The Russell 2000 (1785.34) staged yet another mini breakout. After breaking out of major resistance north of 1600, the small cap index went sideways for several sessions at 1740s, which is where it closed out last week. This week, post-Moderna news on Monday, it broke out, rallying to a new intraday high of 1805.20 on Wednesday.
Post-vaccine news and rising optimism that the US economy will begin to get back to normal next year, investors are gravitating toward small-caps. Duration and magnitude notwithstanding, a growth-to-value shift is taking place. Non-commercials, too, are beginning to buy into this thesis, with net longs in Russell 2000 mini-index futures at a 38-week high. At some point, this trade will get lop-sided. Thus far, there are no signs of distribution.
US Dollar Index: Currently net short 974, down 154.
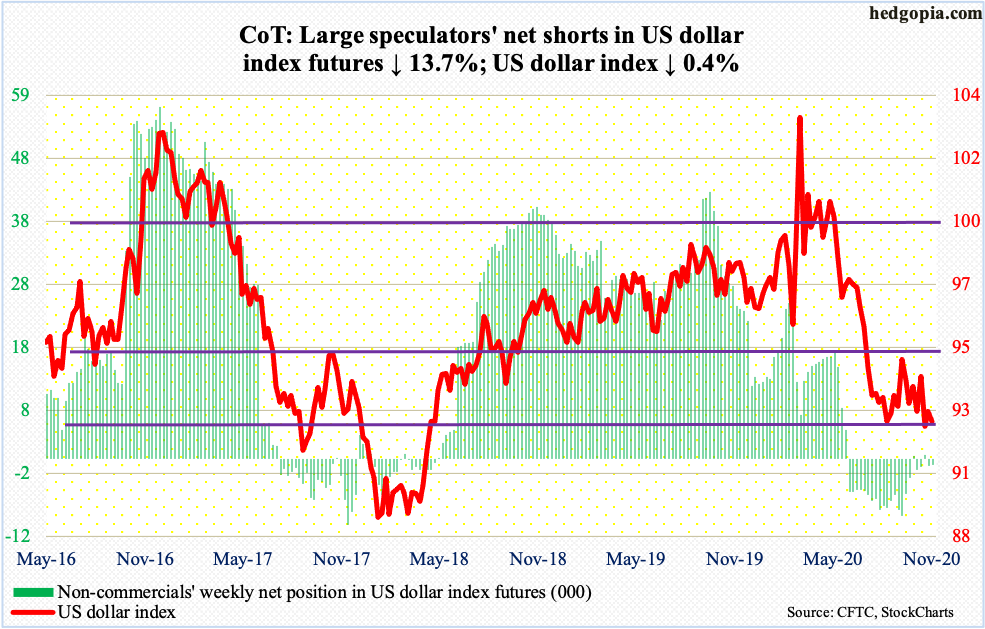
Dollar bears keep attacking 92, which goes back to at least June 2003. Bulls have defended the support for three months now. But rallying off of it has proven difficult.
For over three months now, the US dollar index (92.39) has played ping pong between 94 and 92. Either way it breaks, momentum likely follows – at least in the near term. As things stand, breach risks are there, but until that happens, bulls deserve the benefit of the doubt.
VIX: Currently net short 87.2k, down 2.3k.
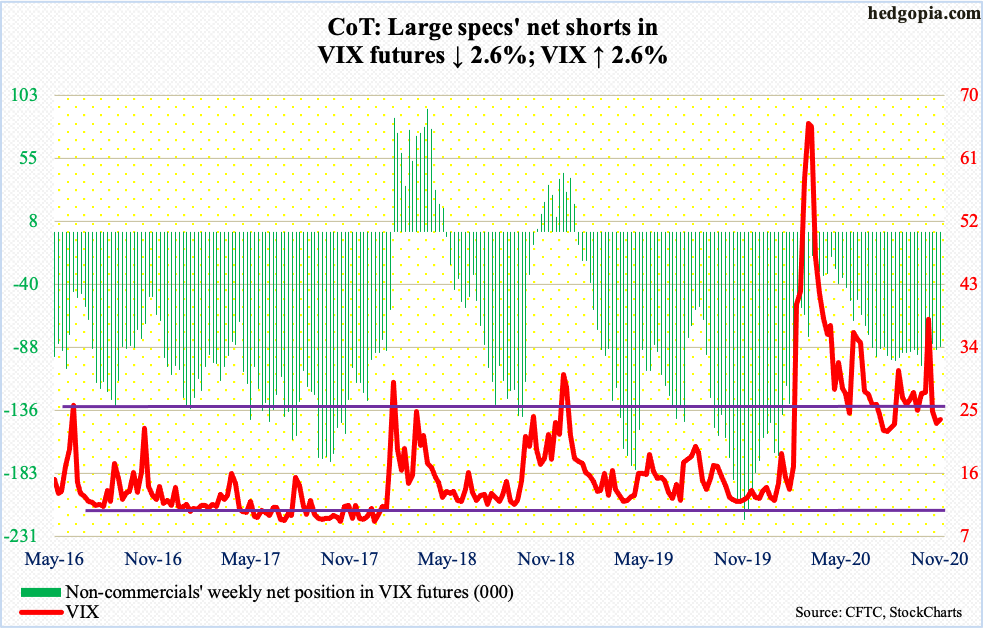
On Wednesday, VIX dropped to 21.66 intraday, which was nearly a three-month low; but by the time the session was over, it reversed higher to close at 23.84 for a hammer session. The daily is itching to move higher. Friday produced another hammer.
For volatility bears to get traction, low-20s needs to break, which has not happened since VIX (23.70) shot up in February, peaking at 85.47 in March. Major equity indices have since gone on to post new highs, but VIX has managed to hold its own. Even amidst the prevailing euphoria, the demand for protection is there.
Thanks for reading!
