
Following futures positions of non-commercials are as of December 1, 2020.
10-year note: Currently net long 25.7k, down 89.2k.
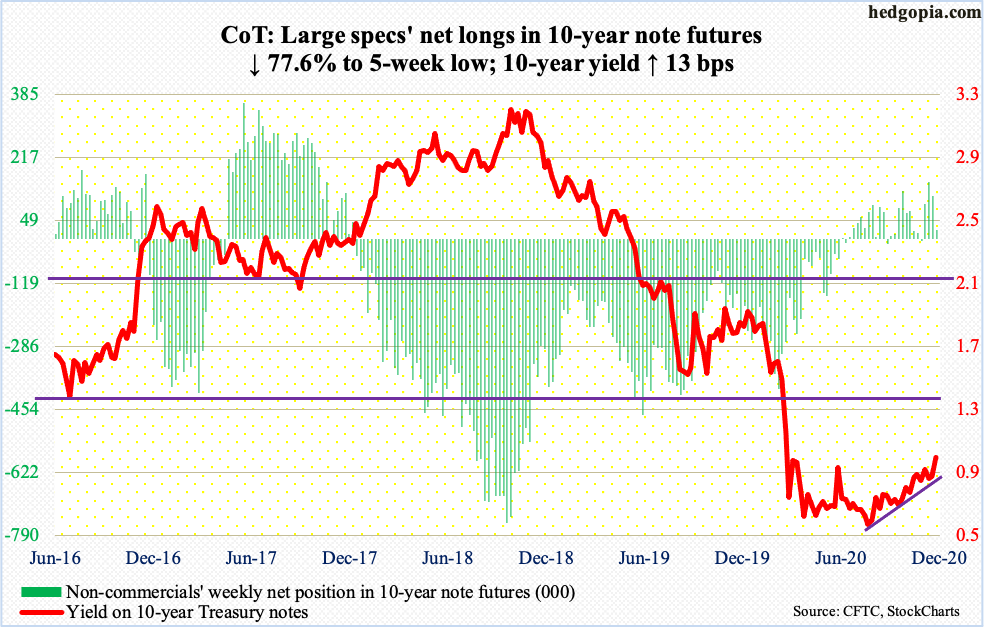
Once again, the 10-year Treasury yield (0.97 percent) is back at testing the one percent level. Friday, rates rose as high as 0.99 percent intraday. The 10-year was yielding 0.84 percent on November 30. Before that, on the 9th last month, the day Pfizer (PFE) announced its positive vaccine news, rates hit 0.98 percent before retreating. Even earlier, on June 5, the 10-year tagged 0.96 percent.
The last time the 10-year yielded one percent was on March 20. It has based long enough for a breakout to occur. Encouragingly for bond bears (on price), rates have made higher lows since bottoming at 0.4 percent in March, and particularly the past four months. A breakout opens the door to a test of 1.5 percent.
Non-commercials promptly cut back net longs in 10-year note futures from 152,319 contracts two weeks ago to 25,748 this week.
The question is, should rates break out, how long before the Fed at least tries to jawbone them down? There is too much leverage in the economy. Further, low rates have provided a big tailwind to housing.
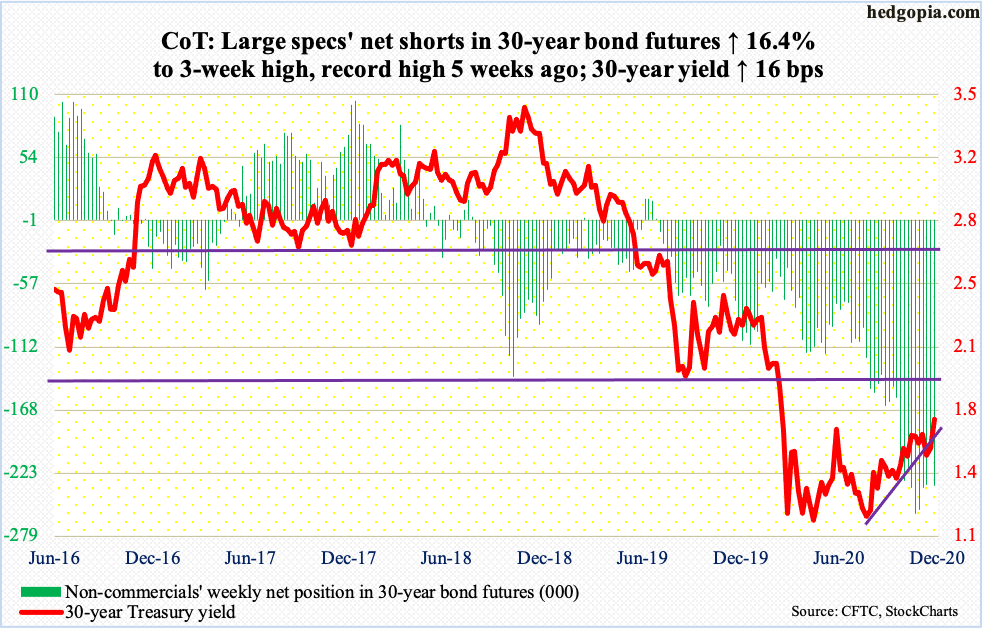
30-year bond: Currently net short 235.1k, up 33.2k.
Major economic releases for next week are as follows.
The NFIB Optimism Index (November) and labor productivity (3Q20, revised) come out Tuesday.
In October, small-business job openings dropped three points month-over-month to 33. Post-pandemic, it hit 23 in May. Its record high was 39, which was hit three times between December 2018 and July 2019.
Preliminarily, non-farm output/hour rose at an annual rate of 4.9 percent in 3Q20. This was the fastest pace since 4Q09.
Job openings (JOLTS, October) are scheduled for Wednesday. Openings were up 84,000 m/m in September to 6.44 million. Pre-pandemic, job openings were seven million in January and bottomed at five million in April.
The consumer price index (November) is due out Thursday. In October, both headline and core CPI were unchanged m/m. In the 12 months to October, they respectively rose 1.2 percent and 1.6 percent.
Friday brings the producer price index (November) and the University of Michigan’s consumer sentiment index (December, preliminary).
Producer prices increased 0.3 percent m/m in October and 0.5 percent in the 12 months to October. Core PPI over the same time period advanced 0.2 percent and 0.8 percent, in that order.
Consumer sentiment fell 4.9 points m/m in November to 76.9. The index reached 71.8 in April and was 101 in February.
WTI crude oil: Currently net long 560.3k, down 1.7k.
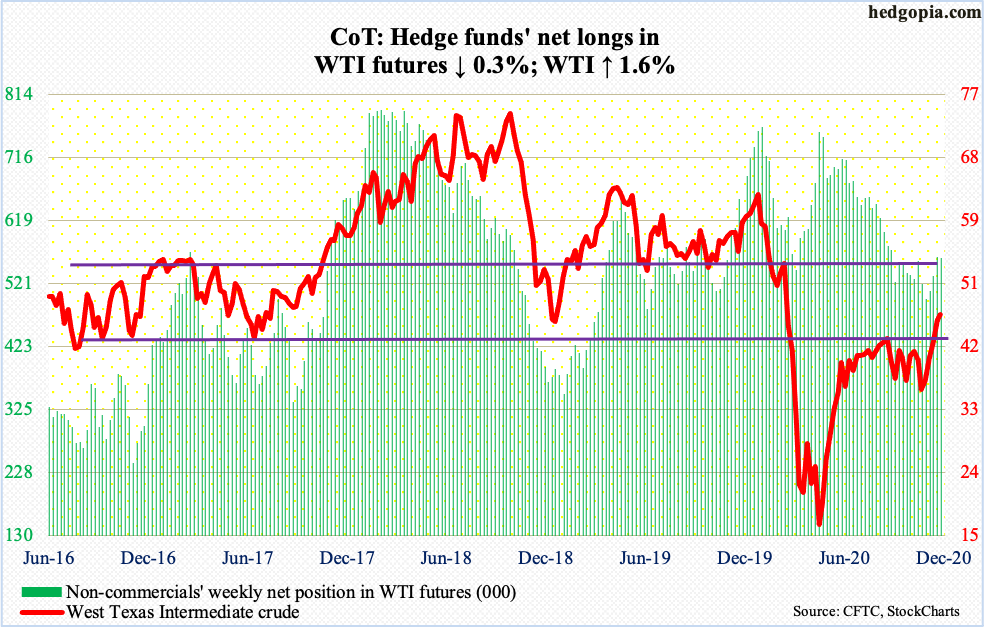
OPEC+, consisting of 13 OPEC members and a group of 10 Russia-led producers, agrees to raise crude production by 500,000 barrels a day in January. This can be interpreted as a vote of confidence on their part that oil demand will firm up next year.
The price of crude has recovered massively from April when Brent dropped as low as $15.98/barrel and WTI $6.50. Intraday Friday, the latter tagged $46.68.
Ahead of this, WTI ($46.26) drew sellers at $42-$43 for over four months. It broke out two weeks ago. This Wednesday, the breakout was just about tested, with the crude touching $43.92 intraday. That dip was bought. As long as this resistance-turned-support draws bids, bulls have a shot at $49-$50.
In the meantime, US crude production rose 100,000 b/d to 11.1 million b/d in the week to November 27. The EIA report also showed crude imports increased 171,000 b/d to 5.4 mb/d. Stocks of gasoline and distillates rose as well – up 3.5 million barrels and 3.2 million barrels to 233.6 million barrels and 145.9 million barrels, in that order. Refinery utilization dropped five-tenths of a percentage point to 78.2 percent. Crude stocks, however, declined 679,000 barrels to 488 million barrels.
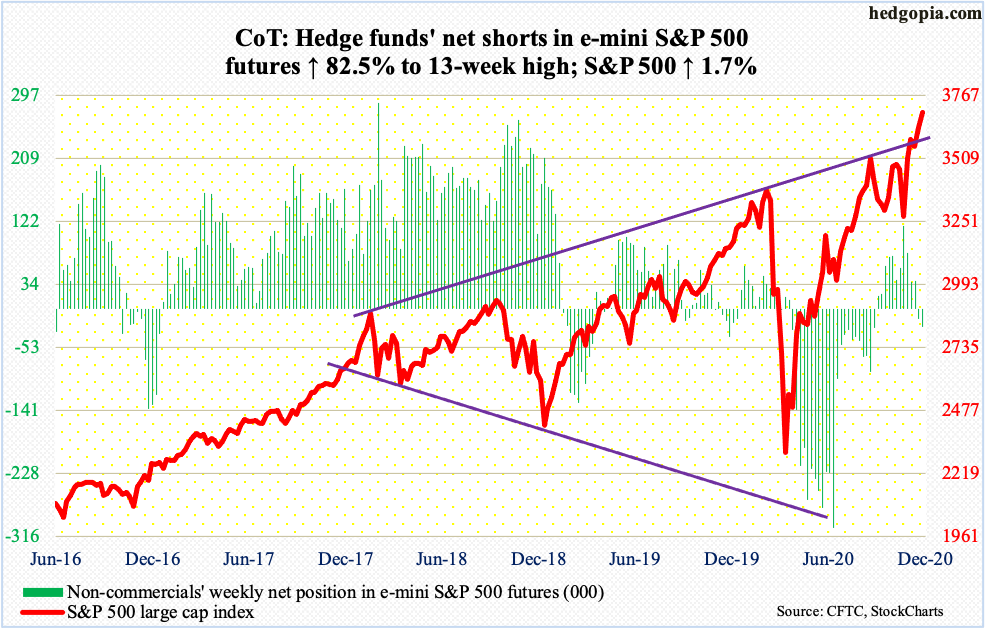
E-mini S&P 500: Currently net short 24.4k, up 11k.
Another $7.2 billion moved into US-based equity funds in the week to Wednesday. This was the fourth straight weekly inflows for a cumulative $39.8 billion (courtesy of Lipper). In the same week, courtesy of ETF.com, SPY (SPDR S&P 500 ETF), VOO (Vanguard S&P 500 ETF) and IVV (iShares Core S&P 500 ETF) collectively lost $3.7 billion, but this has to do with VOO that saw $7 billion redeemed on Wednesday alone; otherwise, it would have been an up week.
The S&P 500 made three intraday highs this week – 3678.45 on Tuesday, 3682.73 on Thursday and 3699.20 on Friday. Despite signs of fatigue for a month now and the daily in gross overbought territory, the large cap index (3699.12) remains above both 3640s and 3580s.
Post-Pfizer news on November 9, the S&P 500 gapped up, posting a new intraday high of 3645.99 but only to give back most of its gains to close the shooting star session at 3550.50. Earlier on September 2, the index retreated after printing 3588.11. On Monday, early weakness was bought at 3590s. Then on Tuesday and Wednesday, 3640s was defended. As long as bulls successfully defend these levels, they deserve the benefit of the doubt. A failure to do so can negatively impact investor sentiment, which is excessively bullish (more on this here).
Euro: Currently net long 139.9k, up 1.6k.
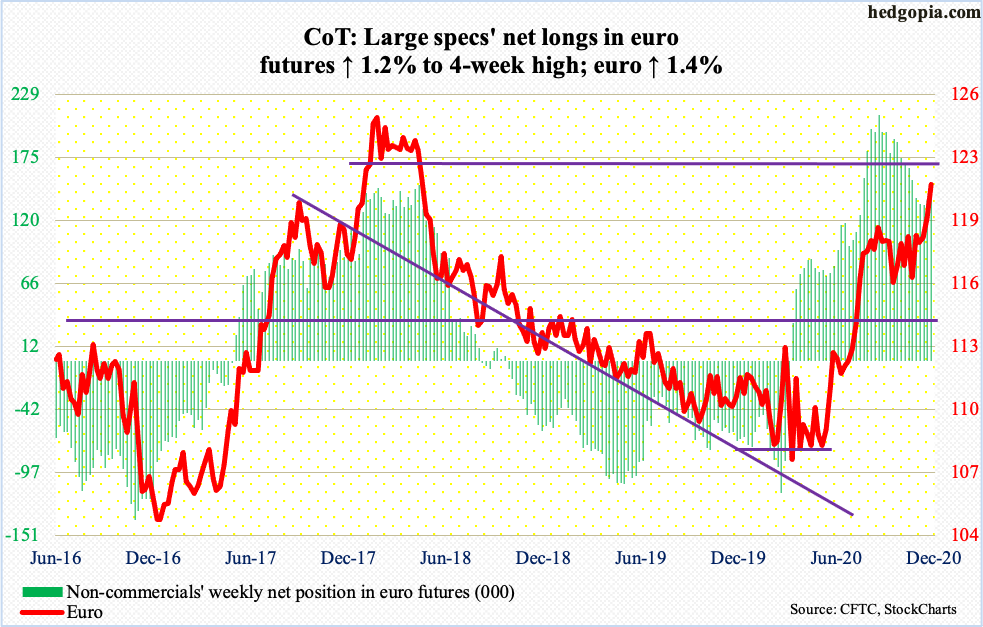
Euro bulls built this week on last week’s weekly hammer. The currency rallied 1.4 percent this week, breaking out of major resistance at $1.19-$1.20. This ceiling goes back to May 2003. Bulls hammered on this for four months before it gave way. The dollar’s plight helped, as the euro makes up 57.6 percent of the US dollar index.
Once $1.19-$1.20 fell, the euro ($1.2122) quickly rallied to test the next level of resistance at $1.21-$1.22. Thursday’s intraday high was $1.2175. The daily is way overbought. In the event bulls are able to clear this hurdle as well, they will soon be eyeing $1.25. Before that happens, they may very well have to defend a retest of this week’s breakout.
Gold: Currently net long 260.3k, up 16.4k.
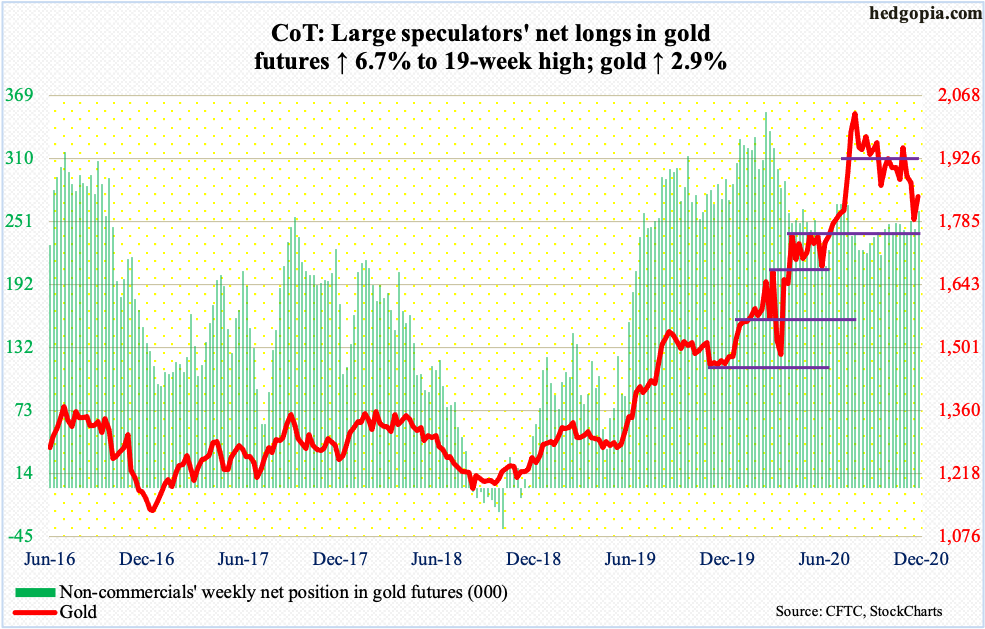
After having lost one after another support since peaking at $2,089.20 on August 7, gold bugs defended horizontal support at $1,750s this week. Monday, gold ($1,840/ounce) printed an intraday low of $1,767.20 before bulls put their foot down. The 200-day moving average was recaptured in the very next session. By Friday, $1,850s, which was lost two weeks ago, was tested; bulls need to reclaim this level before the 50-day ($1,882.93), followed by $1,920s, is tested.
Amidst this, non-commercials raised net longs to a 19-week high.
Flows, however, which at one time acted as a strong tailwind, are turning into a headwind. In the week to Wednesday, GLD (SPDR Gold ETF) lost $198 million and IAU (iShares Gold Trust) $289 million (courtesy of ETF.com). This was GLD’s seventh straight weekly outflows, for redemptions totaling $5.2 billion. The ETF is still up $14.7 billion since late March. Gold bottomed back then at $1,450.90, meaning longs have tons of profit on paper. In those 37 weeks, IAU had three weekly outflows, for a total haul of $8.2 billion.
Nasdaq 100 index (mini): Currently net short 22.6k, down 175.
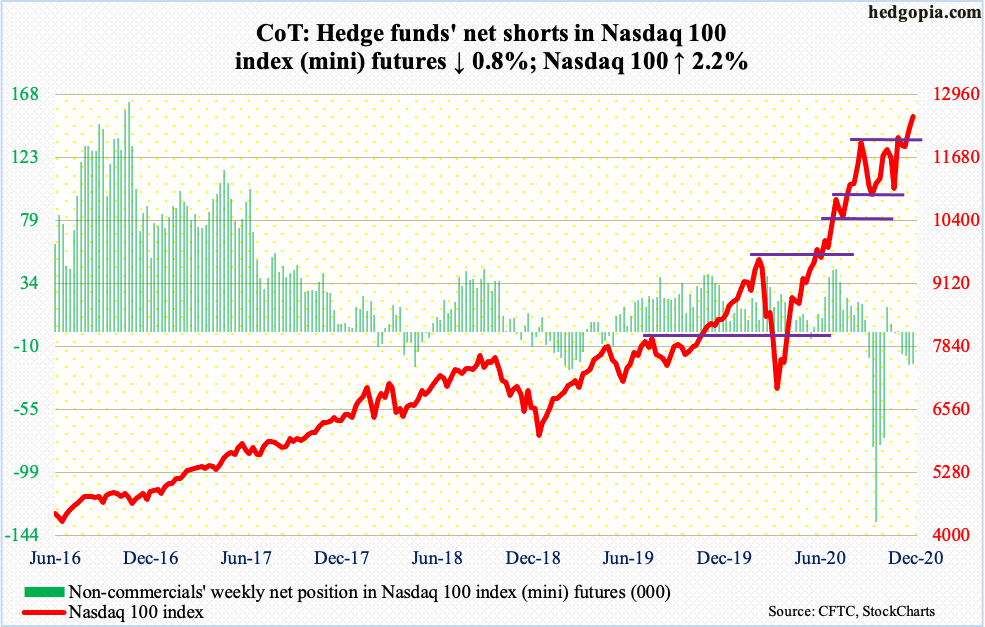
On September 2, the Nasdaq 100 rallied to 12439.48 intraday but also formed a hanging man. For the next three months, the index essentially went sideways. Rally attempts were repeatedly denied at 12200-12300.
Monday, the index (12528.48) posted a new high of 12510.02, which was then eclipsed on Thursday when 12538.92 was hit intraday. Amidst all these highs, conviction is lacking. The daily is overbought. Tech bulls cannot afford to lose the aforementioned support, which now approximates the 10-day.
Russell 2000 mini-index: Currently net long 38.6k, down 8.1k.
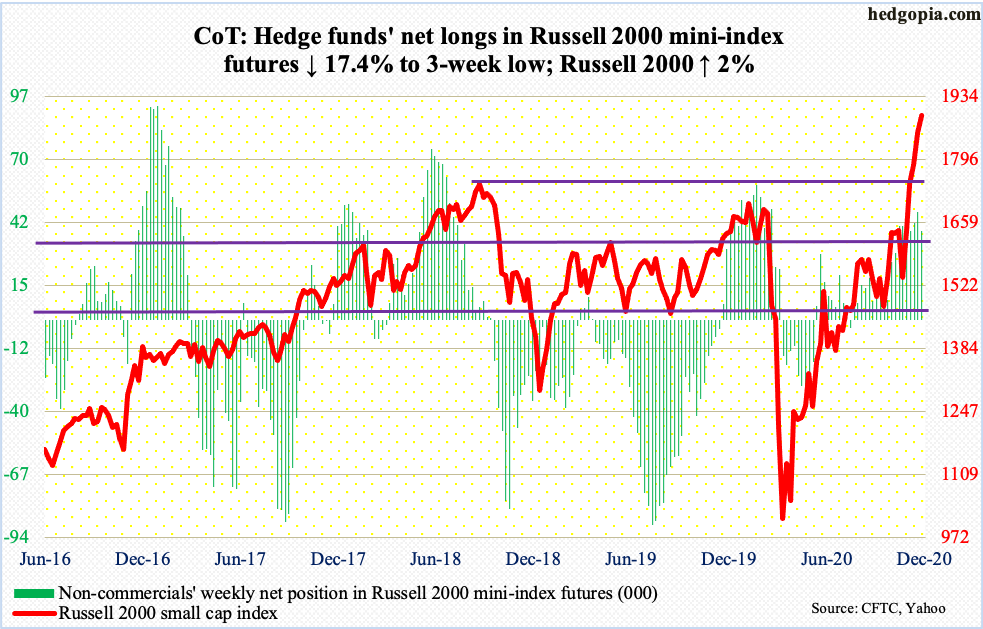
Small-cap bulls enjoyed yet another mini-breakout on the Russell 2000 (1892.45).
Right after the November 3rd presidential election, the small cap index decisively broke out of 1600-plus, which had been an important price point dating back to January 2018. Post-positive vaccine news from Pfizer on the 9th last month, it rallied more, and still more a week after that when Moderna (MRNA) announced its own positive vaccine news. It was also on the 16th the Russell 2000 conclusively rallied past the prior high of 1742.09 from August 2018.
For the past eight sessions, rally attempts were rejected at 1850s-60s. At the same time, bulls absorbed selling pressure by showing up at the 10-day. Friday, the Russell 2000 broke out; the economy created fewer jobs than expected in November, but it seems no one wants to sell the now-outperforming small-caps in a seasonally favorable period.
US Dollar Index: Currently net short 3.1k, up 321.
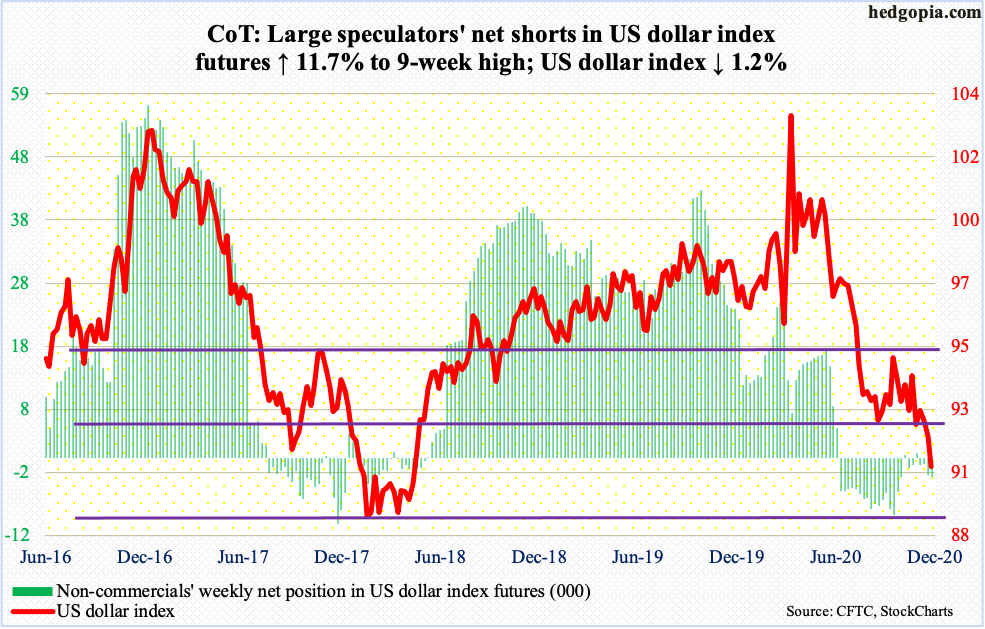
No sooner did the US dollar index lose 92 than selling intensified. This support goes back to at least June 2003. After defending for three months, dollar bulls lost this level right before Thanksgiving, albeit slightly. As soon as December began, a new round of selling got underway.
Friday, the dollar index (90.69) tagged 90.47 intraday, slightly undercutting Thursday’s intraday low of 90.50. Unless things stabilize soon, bears are probably eyeing multi-year horizontal support at 88-89.
VIX: Currently net short 91k, up 4.3k.
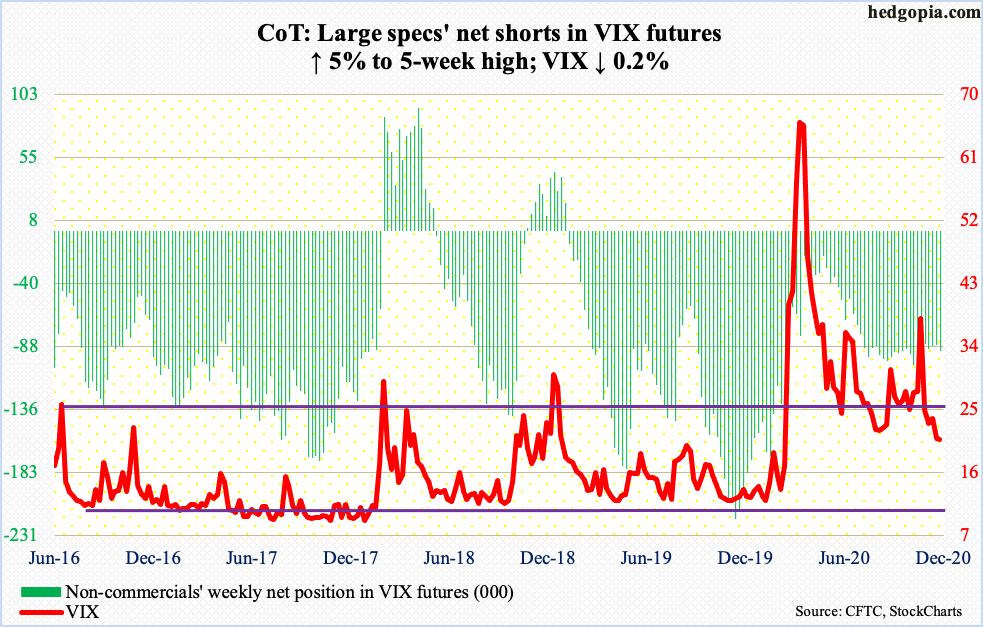
VIX (20.79) held up better versus the S&P 500 which rallied 1.7 percent. The volatility index was only down 0.05 for the week.
VIX broke 20 last Friday, but volatility bears were unable to build on that. This occurred again on Friday. This week, Wednesday producer a hammer, Thursday a doji and Friday another hammer – all this right underneath the 10-day. The daily MACD looks to be on the verge of a bullish crossover.
Concurrently, traders keep aggressively accumulating calls. In three sessions this week, the CBOE equity-only put-to-call ratio produced readings in the 0.30s, and the other two in the 0.40s. The 21-day moving average of the ratio made a new all-time low of 0.428 on Friday. Sentiment is effusive. Unwinding is just a matter of time and will be painful once the process begins.
Thanks for reading!
