
Following futures positions of non-commercials are as of February 2, 2021.
10-year note: Currently net long 58.7k, up 21.8k.
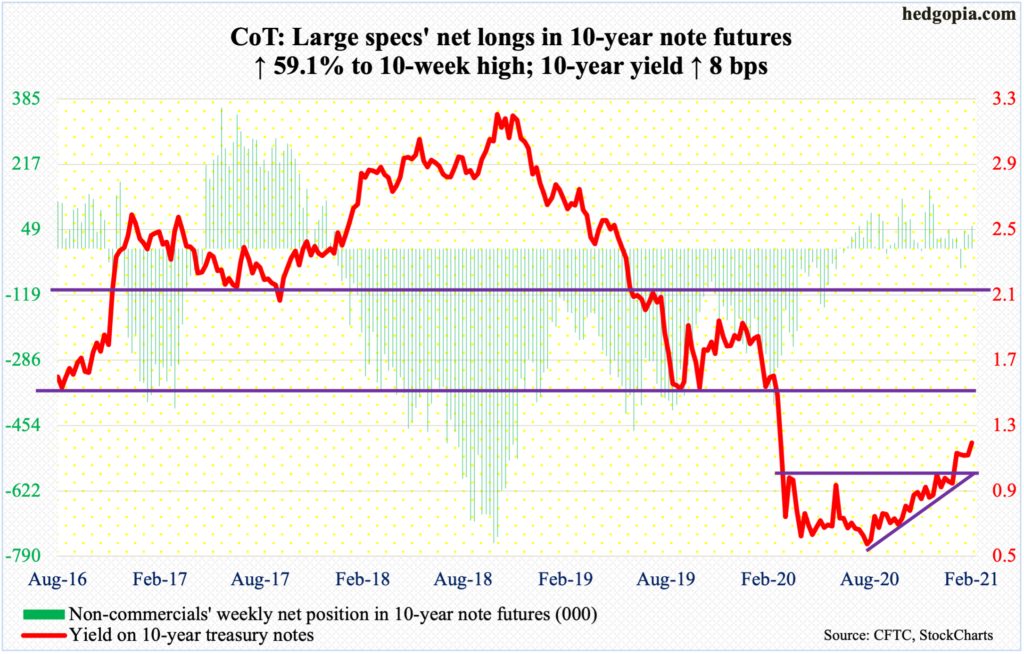
So far so good from bond bears’ perspective (from price point of view). After having failed just under one percent for nine months, the 10-year treasury yield reclaimed that level on January 6. This was then followed by a rally to 1.19 percent by the 12th and a successful breakout retest on the 27th. From that low, rates gradually rallied to culminate in a test on Friday of last month’s high before closing the long-legged doji session at 1.17 percent.
It is also important to point out that the one-percent breakout also formed part of an ascending triangle. A takeout of 1.19 percent will be one more step toward 1.40 percent where resistance is decent. Should things evolve this way, comes the question, how would the Fed react to this development?
In fact, as soon as the 10-year broke out of one percent, several Fed officials, including Chair Jerome Powell and Vice Chair Richard Clarida, tried to jawbone the bond market saying they would continue to aggressively purchase these bonds – amounting to $120 billion/month in mortgage-backed securities and treasury notes and bonds.
Granted that in the land of interest rates it is not always the level rather the pace of change, owing to the existence of excessive leverage in the system – be it federal, corporate or household – rates rising to 1.40 percent, or toward two percent for that matter, will begin to bite through higher interest payments regardless it happens within a few months, six months or a year.
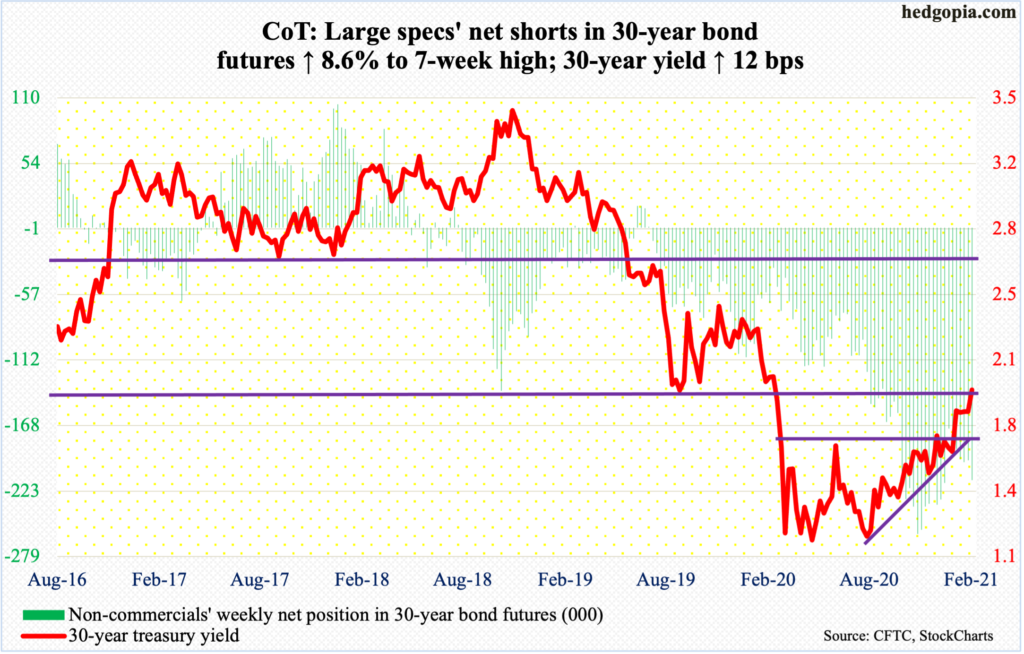
30-year bond: Currently net short 214.4k, up 16.9k.
Major economic releases for next week are as follows.
The NFIB Optimism Index (January) and JOLTs (December) are due out Tuesday.
Small-business job openings declined two points month-over-month in December to 32. Last May, the sub-index was down to 23. Between December 2018 and July 2019, the metric hit 39 three times – a record.
In November, non-farm job openings fell 105,000 m/m to 6.53 million. Openings were down to five million last April, before recovering. They peaked in January 2019 at 7.52 million.
The consumer price index (January) is scheduled for Wednesday. CPI and core CPI respectively rose 0.4 percent and 0.1 percent m/m in December. In the 12 months to December, they increased 1.4 percent and 1.6 percent, in that order.
Friday brings the University of Michigan’s consumer sentiment index (February, preliminary). Consumer sentiment dropped 1.7 points m/m in January to 79. Pre-Covid, sentiment peaked last February at 101, and bottomed at 71.8 in April.
WTI crude oil: Currently net long 535.7k, down 6.8k.
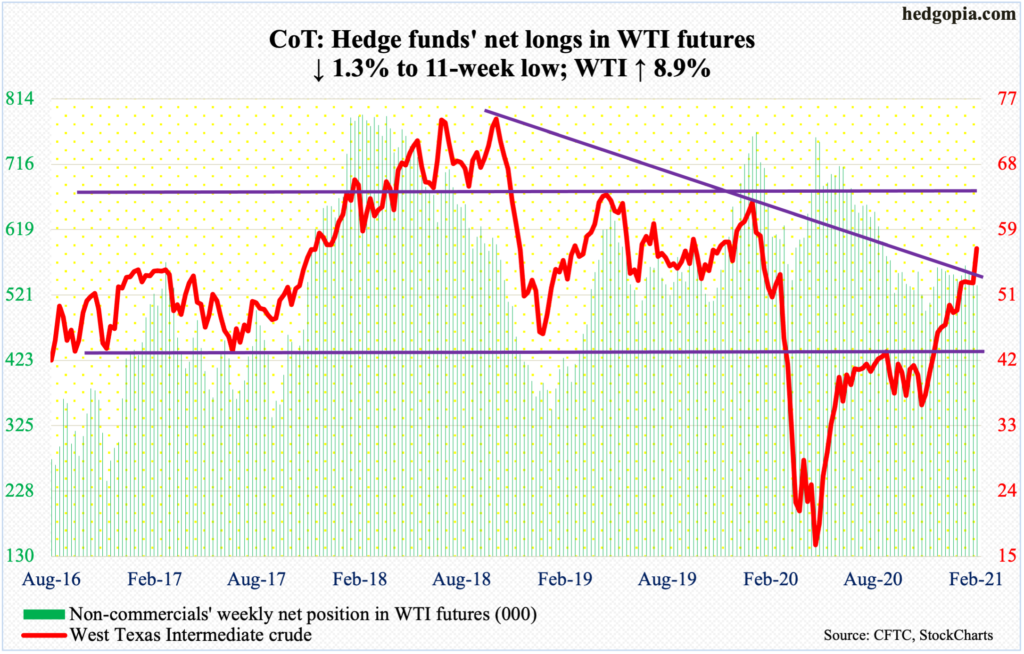
For three weeks, oil bulls were denied just north of $52, but they at the same time were defending shorter-term averages. The trapped energy was released this week as WTI ($56.85/barrel) shot up 8.9 percent, rallying in all five sessions and tagging as high as $57.29 intraday Friday.
With this, the crude is now above a falling trend line from October 2018 when it peaked at $76.90. Around $60 lies a longer-term falling trend line going back to July 2008 when WTI posted record $147.27. This is a bigger test for the bulls.
In the meantime, US crude production remained unchanged at 10.9 million barrels per day. The EIA data is as of January 29. Crude imports increased 1.4 mb/d to 6.5 mb/d. Gasoline stocks rose, too – up 4.5 million barrels to 252.2 million barrels. Stocks of crude and distillates, however, fell 994,000 barrels and 9,000 barrels to 475.7 million barrels and 162.8 million barrels, in that order. Refinery utilization increased six-tenths of a percentage point to 82.3 percent.
E-mini S&P 500: Currently net short 34.9k, up 6.5k.
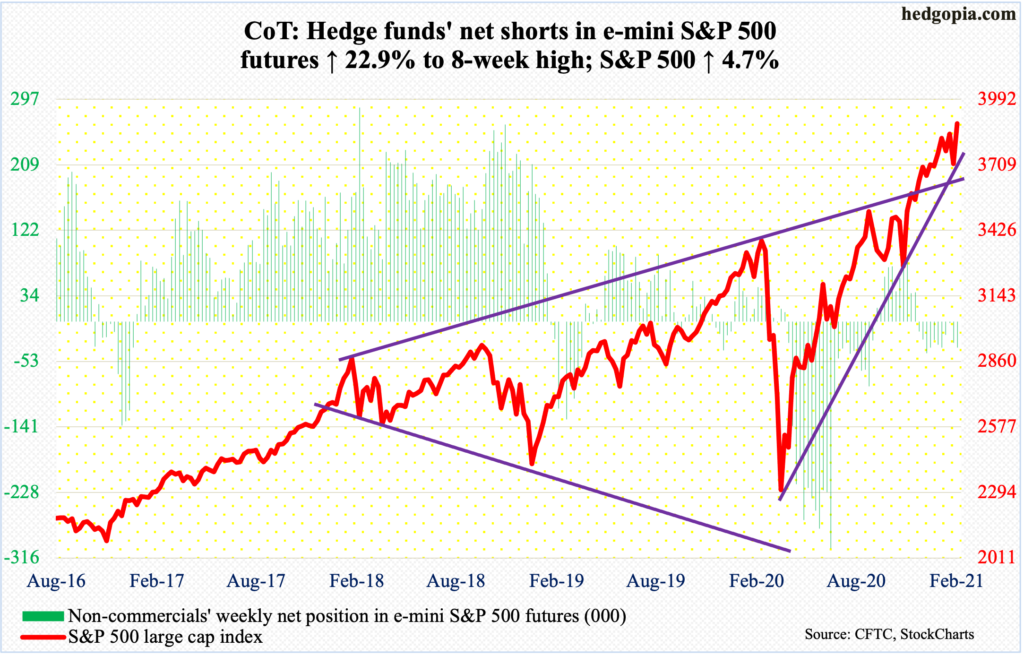
Last week’s rather ominous looking candle was not confirmed.
At the end of January, which was last Friday, the S&P 500 landed right on its 50-day moving average as well as trend-line support from last March. A decisive breach could have shifted momentum to bears’ favor – at least near term. Bulls put their foot down this week. The large cap index has not been below this average for three months now, even as the March trend line drew bids several times in the past. After having achieved this, bulls quickly rallied the index to a fresh high.
This came on the backdrop of outflows in the week to Wednesday of $11 billion from US-based equity funds, which more than offset the $10.6 billion in inflows in the prior three weeks (courtesy of Lipper). In the same week, SPY (SPDR S&P 500 ETF), VOO (Vanguard S&P 500 ETF) and IVV (iShares Core S&P 500 ETF) collectively lost $9.1 billion, coming on the heels of outflows of $3.7 billion in the prior week and $2.6 billion in the week before that (courtesy of ETF.com).
One hallmark since the March low has consistently been a lack of support from fund flows. But the index (3886.83) keeps creeping higher. January produced an ugly looking candle, with the January barometer predicting a down year (more on this here), but February thus far is on its way to nullifying that candle, although there are three more weeks before the month is over.
Bulls now have new short-term support at 3870s.
Euro: Currently net long 137k, down 28.3k.
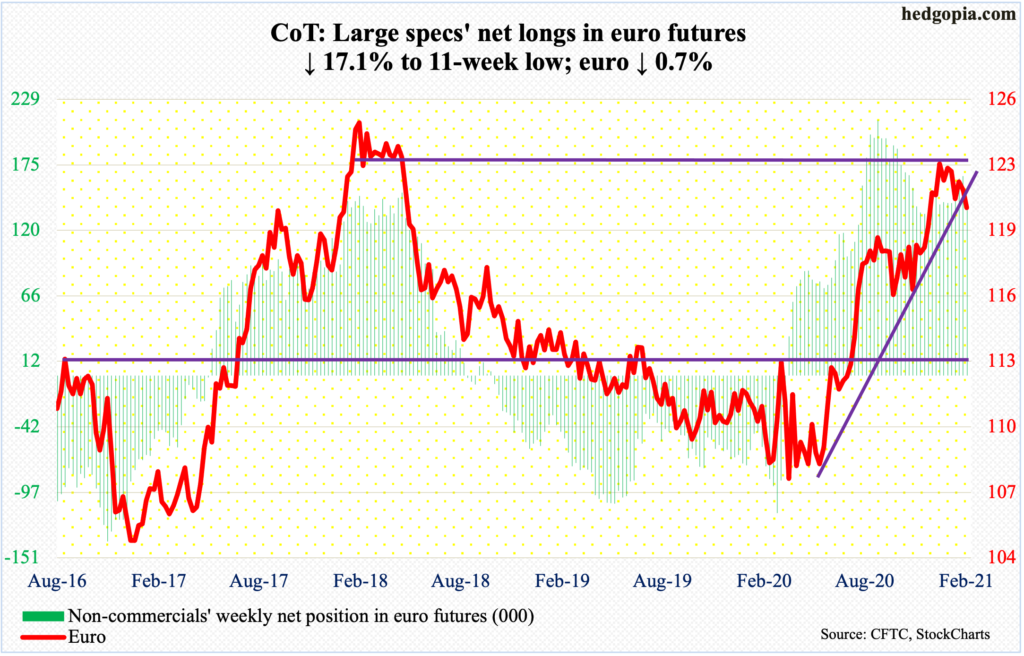
Before this week, euro bulls and bears fought for control of the 50-day ($1.2141) for two weeks. This week, a decision was made. The week began with a loss of the average on Monday, and it progressively got worse. By Thursday, the euro ($1.2050) lost $1.20-$1.21, which goes back more than 17 years and which the bulls reclaimed in early December.
This week’s 0.7-percent decline cost trend-line support from last May. At least near term, with the daily in oversold territory, bulls could have still salvaged the damage by saving $1.18-$1.19, which they did. Thursday’s intraday low was $1.1957, followed by a 0.7-percent rally on Friday.
Gold: Currently net long 257.1k, down 420.
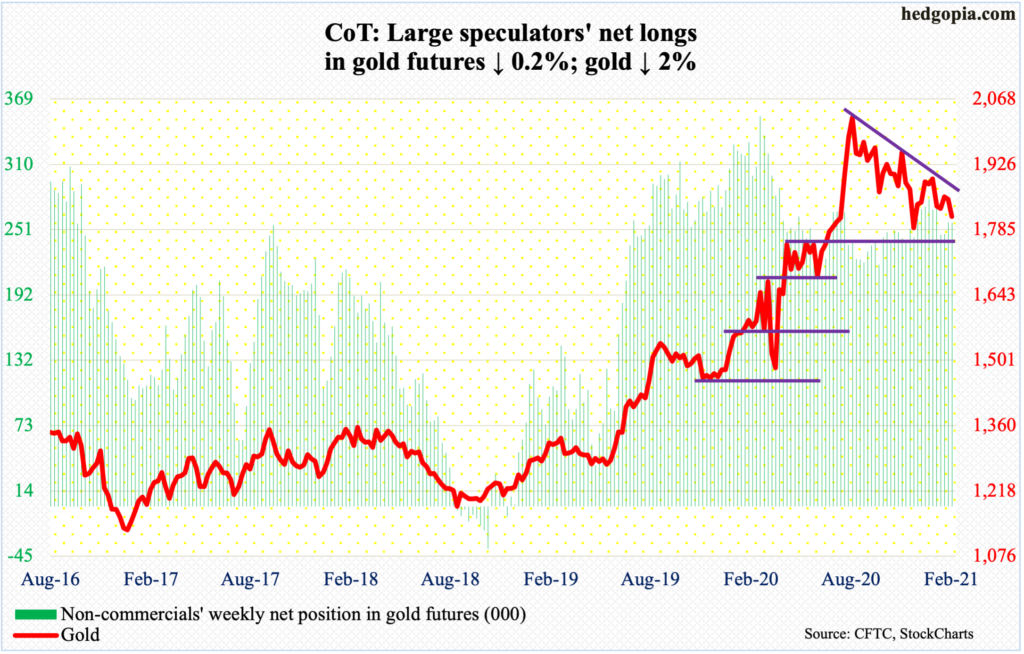
Gold ($1,813/ounce) continues to act like it wants to go test straight-line support at $1,760s-$1,770s. In fact, the yellow metal did make an intraday low of $1,784.60 on Thursday, before rallying 1.2 percent on Friday.
This week, in Monday’s long-legged doji session, the metal rallied just slightly above both the 50- and 200-day, which are converging ($1,855.19 and $1,854.41 respectively), but that proved temporary. The averages were lost in the very next session. For the week, gold gave back two percent.
From August 7 when gold made a new all-time high of $2,089.20, the metal has made lower highs. Gold bugs repeatedly tried to reclaim crucial $1,920s, which is where it peaked in September 2011, but to no avail.
Gold is currently trading within a descending triangle. A loss of $1,760s-$1,770s completes that pattern.
Nasdaq 100 index (mini): Currently net long 29.1k, down 10.6k.
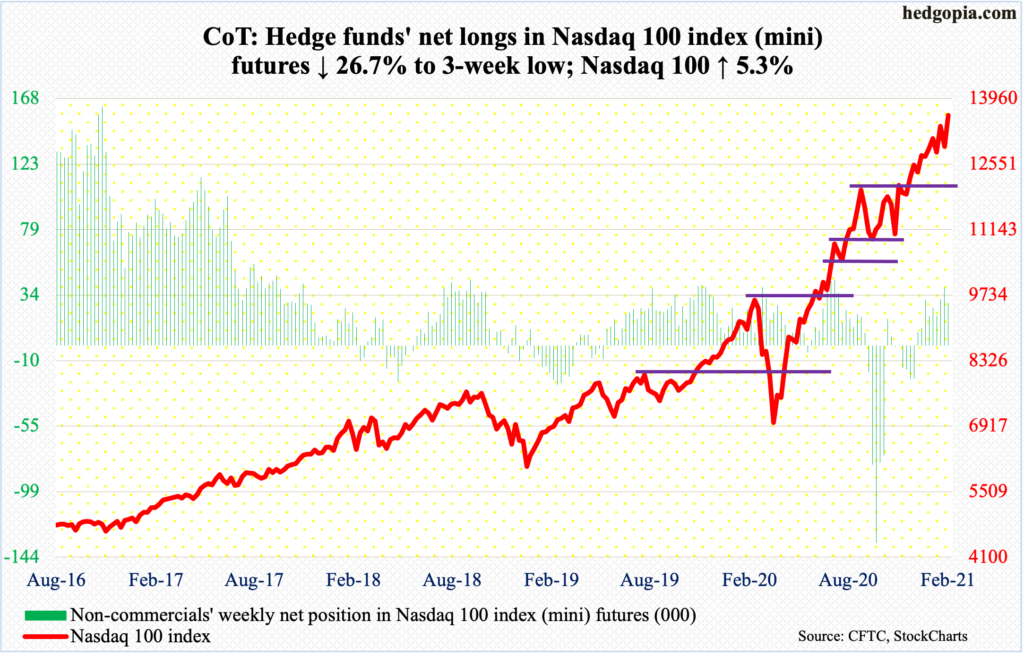
January ended with a long-legged doji, with the Nasdaq 100 giving back nearly all of the 5.3 percent gain to only end up 0.3 percent. The index ended the month sitting on trend-line support from last March. It turns out tech bulls were not ready to lose that level just yet. It was a must-save, and they stepped up to the plate.
On Friday, the index (13603.96) posted a new intraday high of 13642.96, just past the prior high of 13563.70 from January 25. Bulls now have new short-term support at 13560s.
Russell 2000 mini-index: Currently net long 1.9k, up 6.4k.
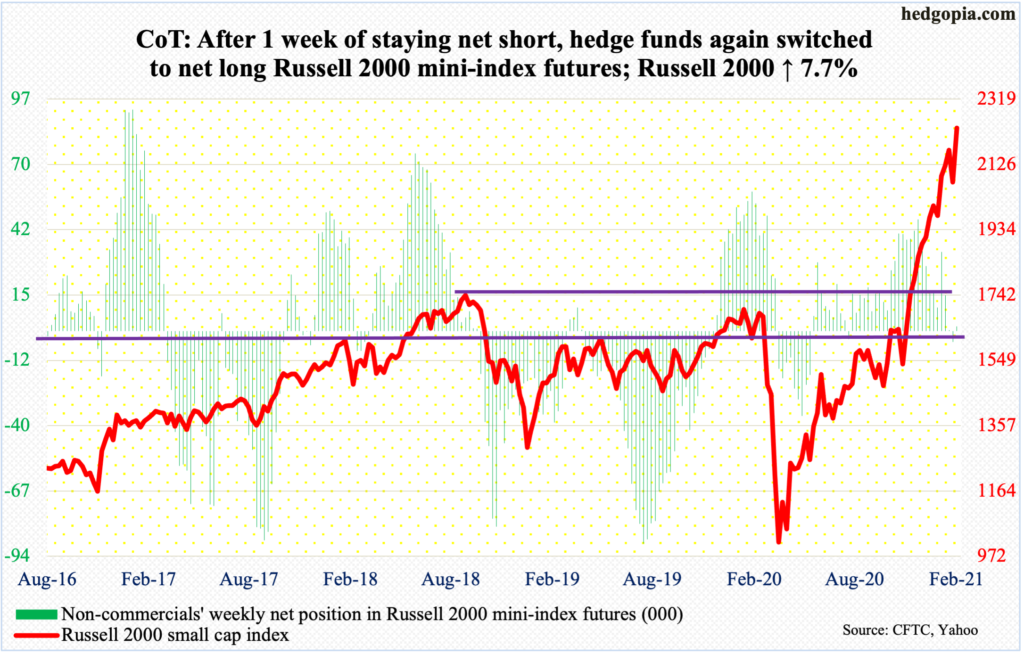
By the 25th last month, the Russell 2000 was up as much as 11.1 percent, but small-cap bulls were unable to hang on to all of the gains, although the month still ended up five percent. As the small cap index came under pressure in the last four sessions, it ended the month right on the bottom end of a rising channel from late October/early November (more on this here). A breach would have emboldened the bears, which otherwise have suffered one after another setback post-November 3 presidential election and particularly after Pfizer (PFE) and Moderna (MRNA) announced positive vaccine news – on November 9 and 16 respectively.
This week, bulls refused to let go of that channel support, and rallied the Russell 2000 (2233.33) 7.7 percent. After this, bulls are probably eyeing 2300, which is where the upper end of the channel in question rests.
US Dollar Index: Currently net short 14.8k, up 111.
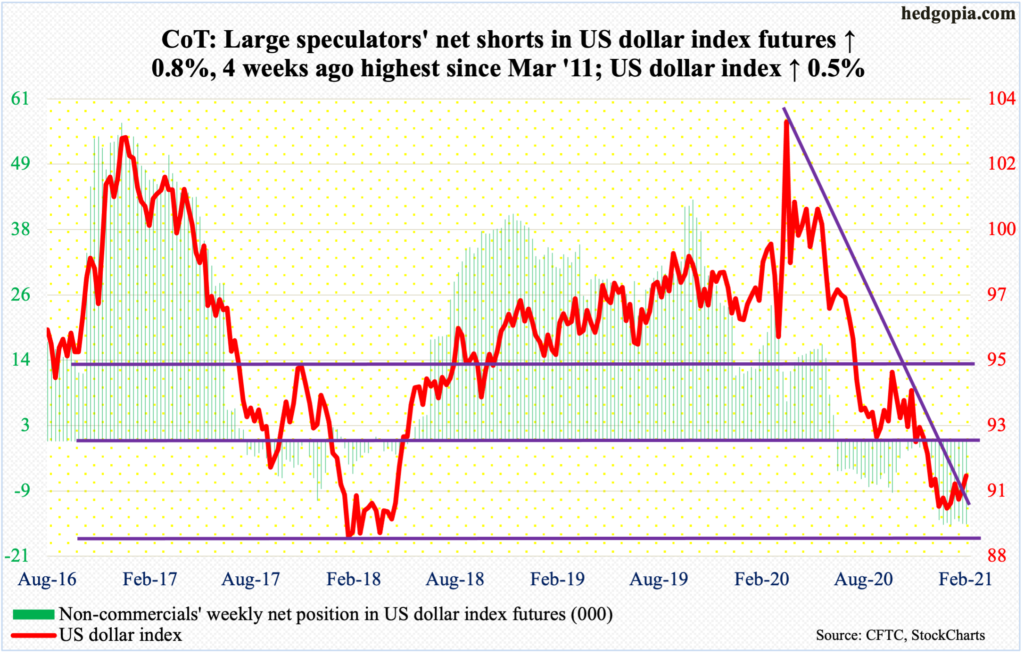
Dollar bulls were in full force this week. They not only took out the 50-day but also a falling trend line from last March when the US dollar index retreated after tagging 103.96.
Earlier on January 6, the index bottomed at 89.17. Support at 88-89 goes back to at least March 2004.
A bigger test lies ahead. Support-turned-resistance at 92 has proven to be an important level going back to at least June 2003. This was lost toward the end of last November. Bulls would have significantly improved their long-term odds should they recapture 92. On Friday, the index (91.03) retreated after posting 91.61 intraday. There is room for continued weakness on the daily. The 50-day lies at 90.56.
VIX: Currently net short 116.5k, down 20.1k.
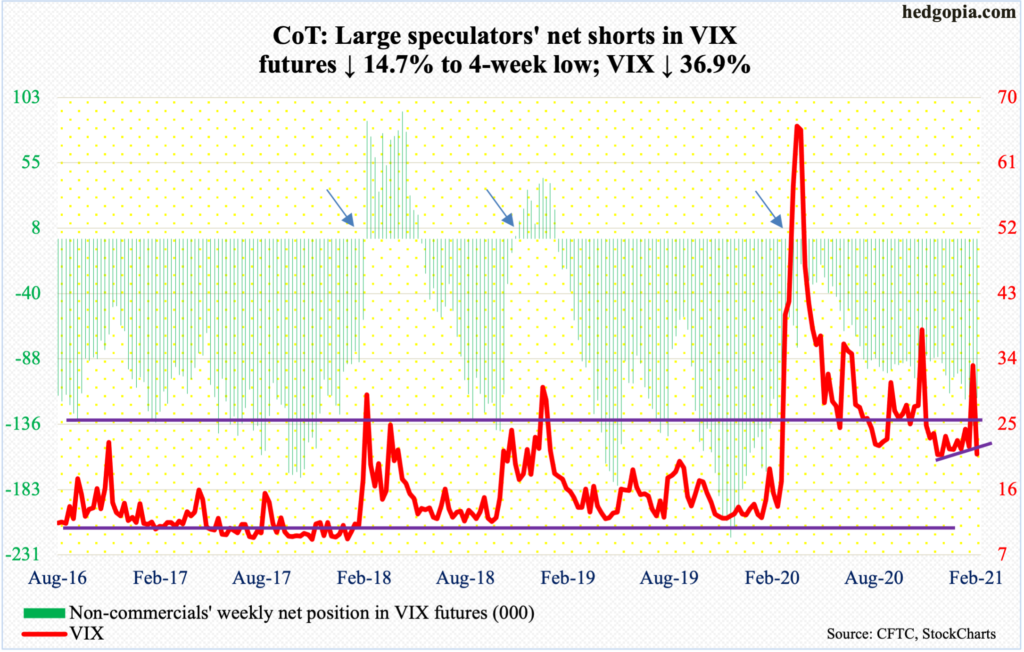
Once again, this was a case of markets significantly bidding up the price of volatility but only to see the momentum quickly melt away. On January 29, VIX touched 37.51 intraday. In the next five sessions, the volatility index dropped to low-20s. Both the 50- and 200-day were lost – again.
For six months now, VIX (20.87) has consistently found support at low-20s. Volatility bulls hope this continues. A breach opens the door toward 17-18.
Thanks for reading!
