
Following futures positions of non-commercials are as of March 23, 2021.
10-year note: Currently net long 12.3k, up 8.2k.
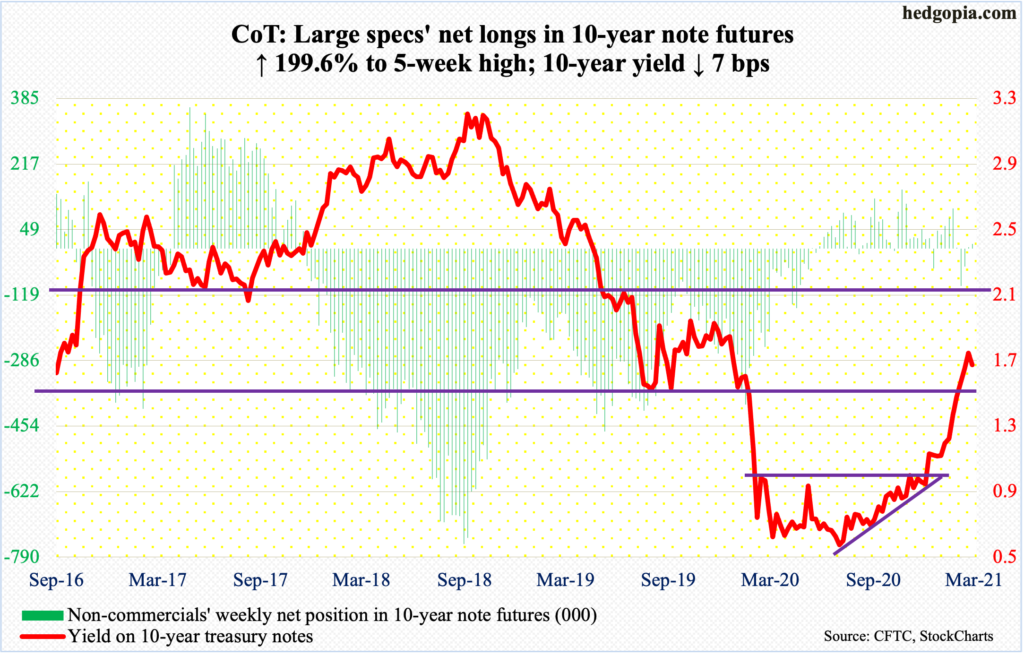
The 10-year treasury yield enjoyed several breakouts this year – out of one percent early January, 1.2 percent mid-February and 1.4 percent later that month, and 1.63 percent toward the middle of this month.
Rates have come a long way from last March’s low of 0.4 percent, resulting in overbought conditions on several timeframes.
Shortly after staging the latest breakout, the 10-year tagged 1.75 percent on the 18th and retreated. Thursday’s low of 1.59 percent tested the 20-day moving average – successfully. By then, some daily indicators had reached the median. This was an opportune time for bond bears (on price) to let the markets know that they had not completely gone way. On Friday, the 10-year rallied five basis points to 1.66 percent, for a successful breakout retest.
The 1.75-percent high from seven sessions ago has now taken on significance. A breakout raises the odds of a run toward two percent. Should things evolve this way, the Fed may begin to act fidgety, resorting to aggressive verbal intervention.
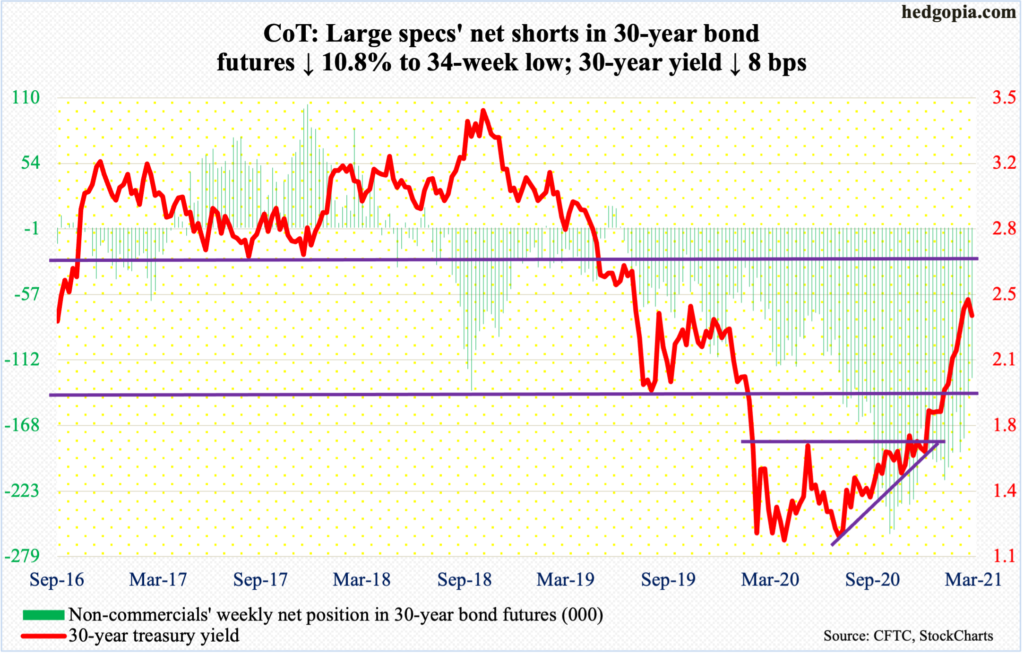
30-year bond: Currently net short 127.8k, down 15.5k.
Major economic releases for next week are as follows. Markets are closed Friday for observance of Good Friday.
The S&P Case-Shiller Home Price Index (January) is scheduled for Tuesday. Nationally, home prices in December jumped 10.4 percent year-over-year. This was the fastest pace since January 2014. Prices have been appreciating at an accelerating pace since August 2019 when they rose 3.1 percent.
The ISM manufacturing index (March) is due out Thursday. Manufacturing activity rose 2.1 points month-over-month in February to 60.8. Last April, the index made a post-pandemic low of 41.7.
Friday brings the employment report (March). Since last April’s low of 130.2 million, 12.9 million non-farm jobs have been created. This is still 9.5 million short of the pre-pandemic high of 152.5 million from February last year.
WTI crude oil: Currently net long 576.1k, up 11.7k.
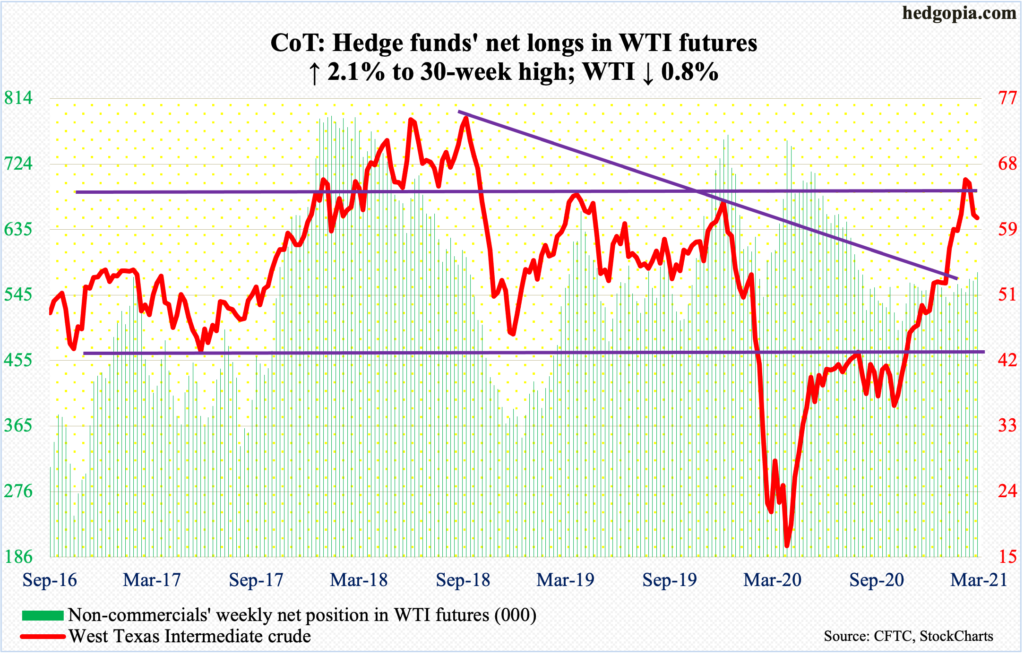
Despite the cargo ship Ever Given blocking the Suez Canal and some oil tankers rerouting around the southern tip of Africa adding a week to the journey, WTI ($60.97/barrel) shed 0.8 percent this week and was down as much as 6.8 percent at Tuesday’s low of $57.25. This was a third straight weekly drop.
WTI peaked at $67.98 on the 8th this month. The drop since saw a real bull-bear duel around the 50-day for the last several sessions. Friday’s 4.1 percent rally pushed the crude back above the average ($59.12).
The daily can rally. Immediately ahead, there is resistance at $63.
In the week to March 19, US crude production rose 100,000 barrels per day to 11 million b/d. As did crude imports, which were up 299,000 b/d to 5.6 mb/d. Stocks rose across the board, with crude up 1.9 million barrels to 502.7 million barrels, gasoline up 204,000 barrels to 232.3 million barrels and distillates up 3.8 million barrels to 141.6 million barrels. Refinery utilization jumped 5.5 percentage points to 81.6 percent – a five-week high.
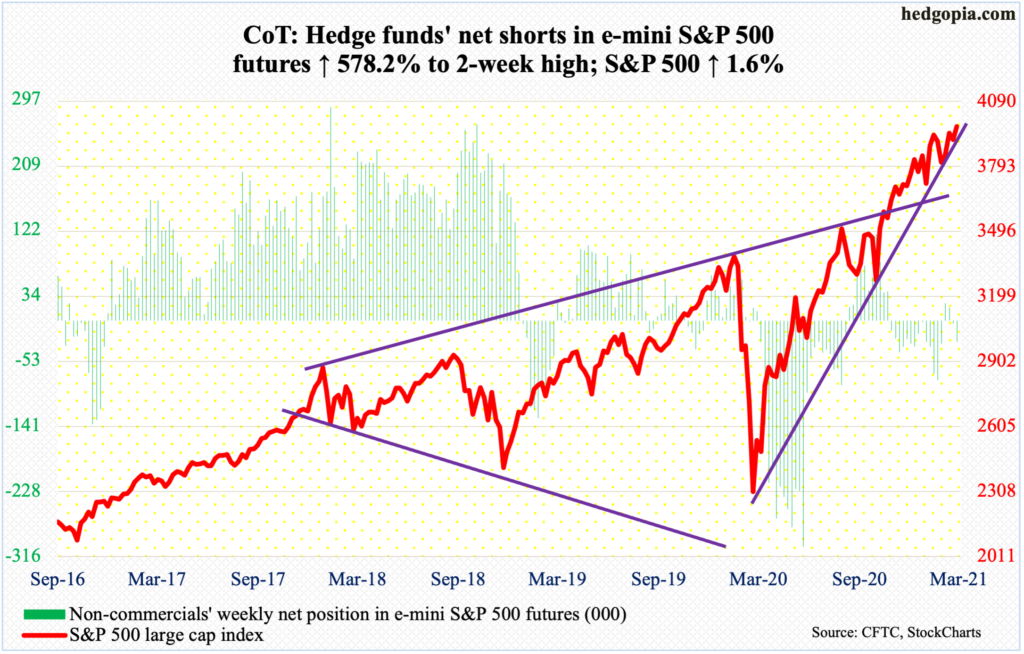
E-mini S&P 500: Currently net short 28.3k, up 24.1k.
In the week to Wednesday, $10.9 billion moved into US-based equity funds, which have now gained $96.9 billion since the week to February 10 – for seven weeks in a row (courtesy of Lipper). In the same week, SPY (SPDR S&P 500 ETF), VOO (Vanguard S&P 500 ETF) and IVV (iShares Core S&P 500 ETF) took in $11.5 billion, which was the highest weekly total since the week to February 10 when $20.6 billion came in (courtesy of ETF.com).
Back then, the S&P 500 peaked on February 16 and then retreated 5.7 percent in 13 sessions intraday, closing below the 50-day for one session; bulls defended 3720s before things could get worse. Once again, the average was tested this Thursday – successfully; through the session low of 3853.50, the large cap index was down 3.3 percent from its high of 3983.87 reached on the 17th.
Until Thursday’s intraday reversal, the S&P 500 (3974.54) was down 1.5 percent for the week, which, when it was all said and done, ended up 1.6 percent. Friday’s 1.7-percent jump was interesting to say the least, with the last hour alone adding 38 points. The March 17th high is within earshot, and a rising trend line from last March has been defended – again.
Euro: Currently net long 93.3k, up 3.3k.
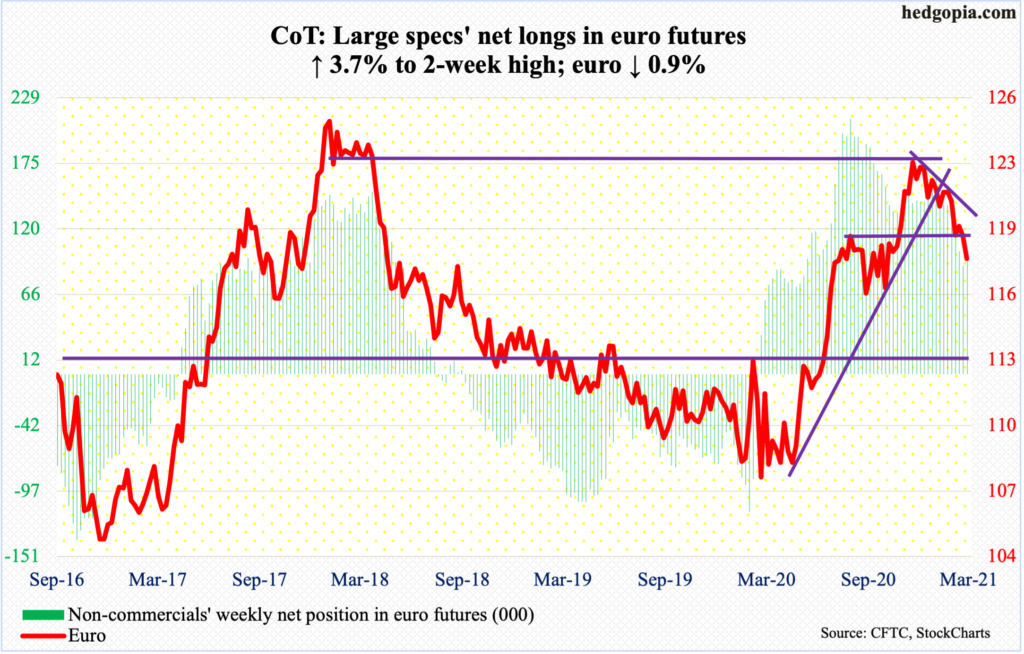
The euro ($1.1799) had a mini breakdown of sorts. Monday’s rally attempt met with selling pressure as it tagged $1.1948. Last week, the currency retreated after tagging $1.1989 and the week before that after tagging $1.1992. Resistance at $1.20-$1.21 goes back more than 17 years.
The 200-day is now gone. The average ($1.1846) likely gets tested in the sessions ahead.
Gold: Currently net long 174.1k, down 6.1k.
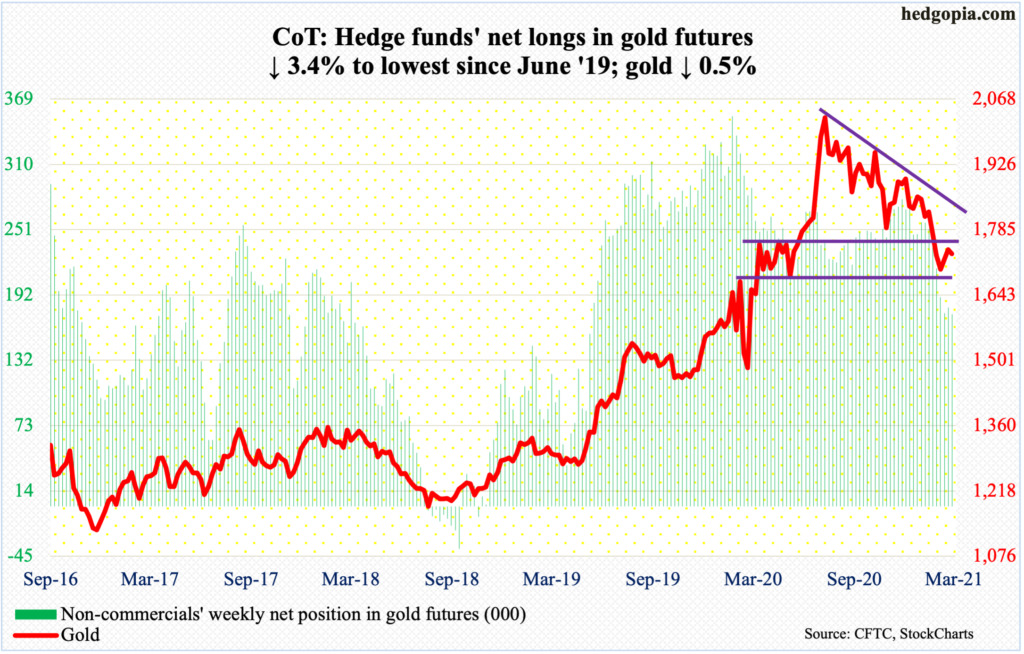
Gold continued to go sideways just below crucial support-turned-resistance at $1,760s-$1,770s, which was lost at the end of February and which was part of a broken descending triangle. The metal essentially finds itself in no-man’s land.
Gold ($1,732.30/ounce) reached its all-time high of $2,089.20 on August 7 last year, followed by a series of lower highs. If the descending triangle pattern completes, the metal could eventually head toward $1,440s.
But before that happens, $1,670s needs to give way. Early this month, gold bugs defended this level (more on this here). But to regain momentum, they need to reclaim $1,760s-$1,770s.
As things stand, they have had no help whatsoever from fund flows. In the week to Wednesday, another $293 million left GLD (SPDR Gold ETF). Outflows began to pick up speed in the week to October 21 last year. In the 23 weeks since, 20 saw redemptions, for a cumulative loss of $13.6 billion (courtesy of ETF.com).
In the meantime, non-commercials have been reducing their net longs for a while now, with holdings lowest since June 2019.
Nasdaq 100 index (mini): Currently net short 12.7k, up 331.
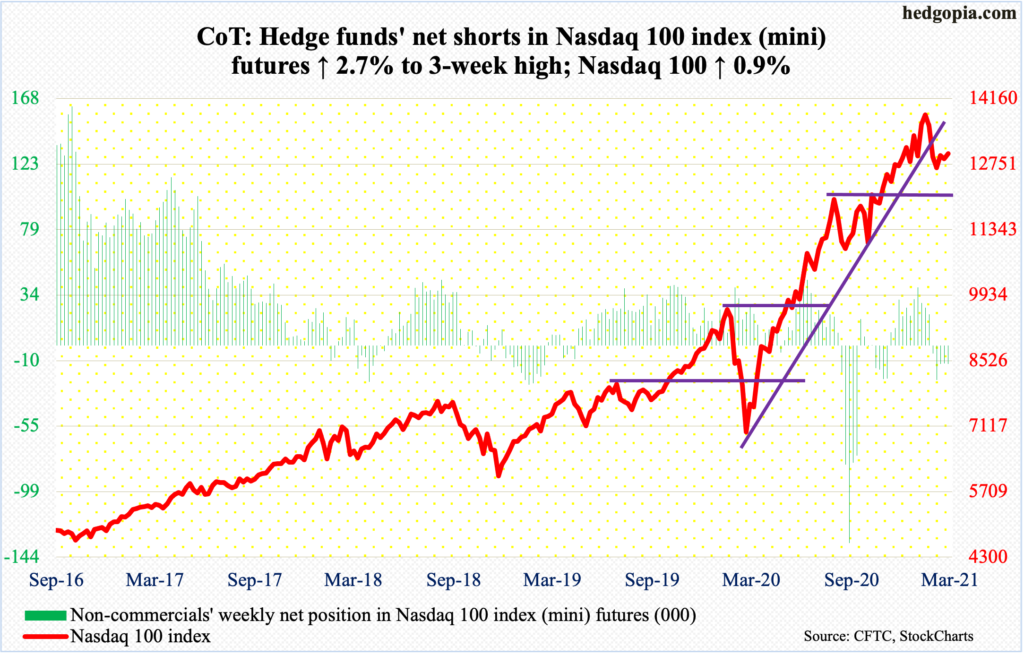
Sellers once again showed up at the 50-day (13174.65). On both Monday and Tuesday, rally attempts stopped at the average. This was also the case last week and the week before that.
The year is young, but so far, tech has found itself on the receiving end, as the so-called growth-to-value shift picked up momentum.
The Nasdaq 100 (12979.12) peaked on 13879.77 on February 16. The S&P 500, too, peaked on that date, but it subsequently went on to post a new high. Not so with the Nasdaq 100, which also lost a rising trend line from last March’s low.
From bulls’ perspective, the good thing – if it can be called that – is that last October’s high of 12200s (12430s in September) was defended early this month. In the latest selloff, this zone was not tested. On Thursday, the index dropped as low as 12627.93 and that was it. But until the 50-day gets taken out, bulls should struggle to regain momentum.
Russell 2000 mini-index: Currently net long 9.2k, down 7k.
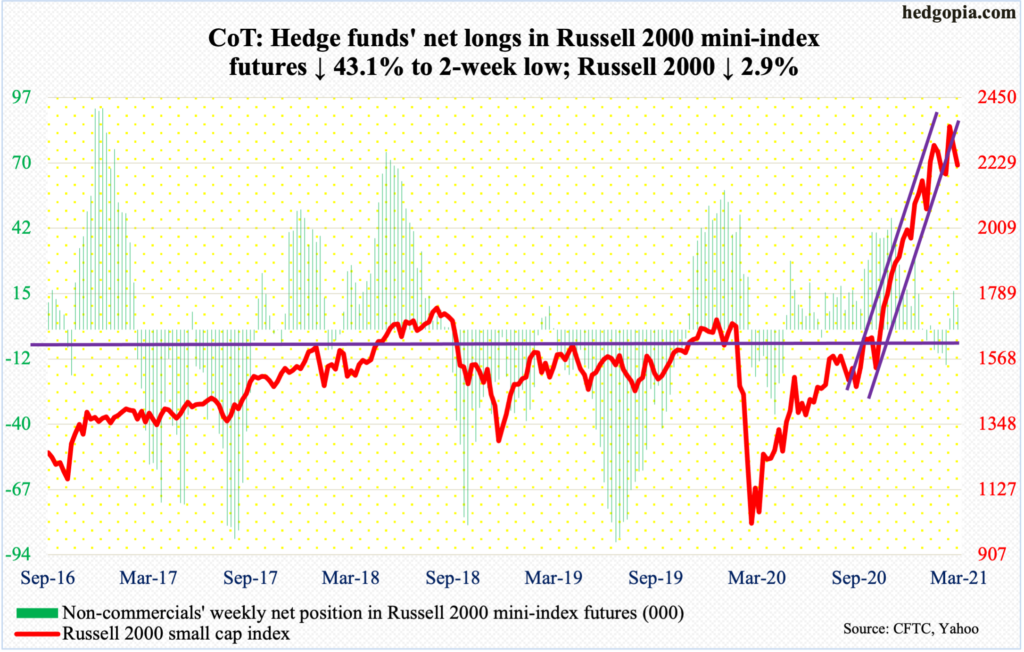
Last March, as Covid-19 was wreaking havoc, the Russell 2000 bottomed at 966.22. This March, as the US economy gets ready for a boom this year, sellers are having the upper hand (more on this here).
The small cap index peaked on the 15th at 2360.17. From that high through Thursday’s low of 2100.27, it dropped 11 percent. A similar selloff occurred from February 10 to March 5 – for a decline of 10.1 percent; selling stopped at 2080s back then. There is horizontal support at 2070s-2080s. Thursday’s (this week) low approximates this. Even if this is followed by a relief rally, weekly and monthly conditions remain grossly overbought.
Perhaps importantly, the Russell 2000 (2221.48) has lost an ascending channel from late October-early November last year. The index can go on to make a new high and this may still be just good enough to test the underside of that broken channel.
US Dollar Index: Currently net long 5.4k, down 454.
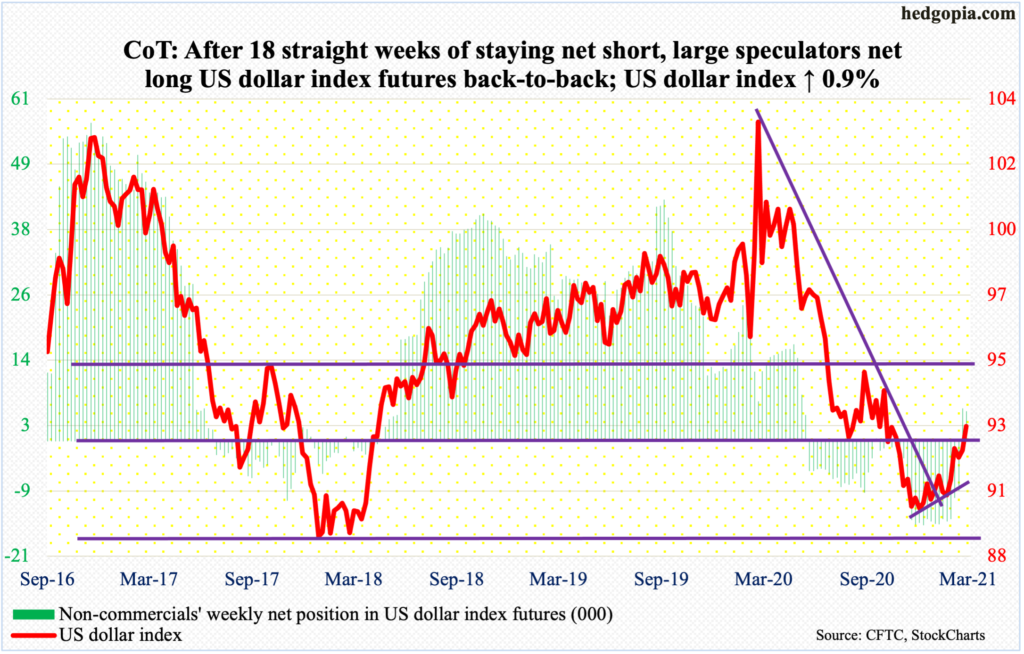
Just when it looked like resistance just north of 92 was proving too much for them to handle, dollar bulls pulled a surprise on the bears.
On Wednesday, the prior high of 92.53 from the 9th fell. Then on Thursday the 200-day (92.74) gave way. This was the first time since late May last year that the US dollar index (92.78) closed above the average.
With this, the index is now at the upper bound of a three-month rising channel, so a pause/giveback is normal. On January 6, it bottomed at 89.17, followed by subsequent higher lows. Support at 88-89 goes back to May 2004. Defense of this support can prove to be significant in due course.
Last week, after 18 consecutive weeks of staying net short, non-commercials went net long. This week, they reduced by 454 contracts but stayed net long.
VIX: Currently net short 102.3k, down 12.3k.
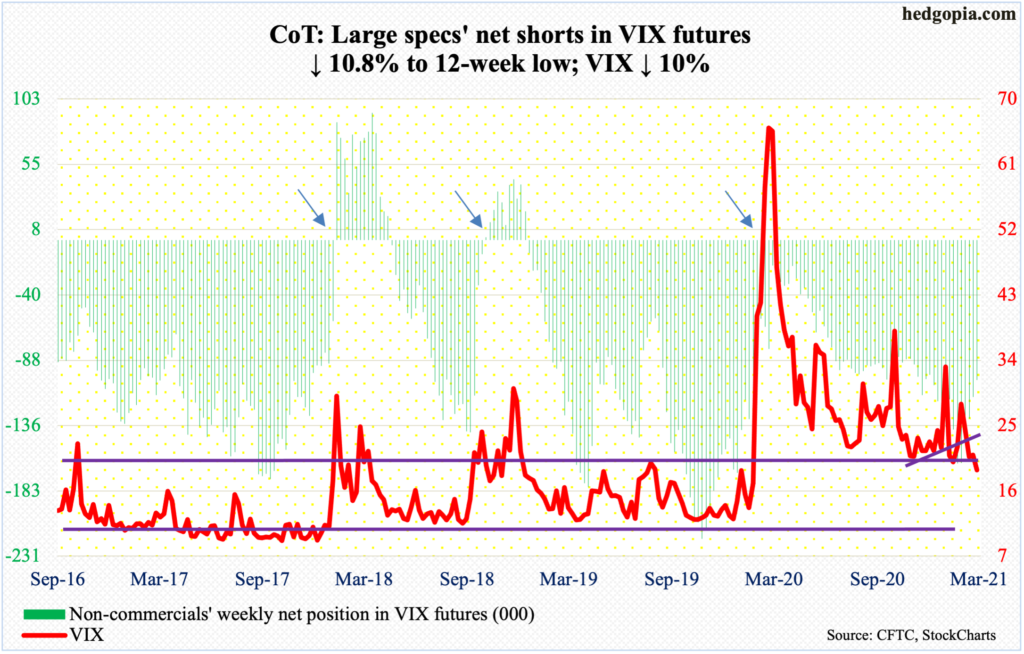
Last week’s low of 18.95 was undercut slightly on Friday as VIX (18.86) posted a low of 18.68. Earlier on Thursday, the volatility index rallied as high as 23.55 but only to get rejected at the 50-day and close poorly at 19.81. A shooting star formed in both sessions.
Since last March when VIX surged to 85.47, it has consistently made lower highs – the latest being 31.90 on the 4th this month. For a higher high, volatility bulls first have to take out both the 50- and 200-day (23.29 and 25.60 respectively), not to mention mid-20s. VIX has not closed above the 200-day since the 4th.
For now, VIX is probably eyeing lower.
Thanks for reading!
